
Introduction to Power BI (Crash Course!)
Contents
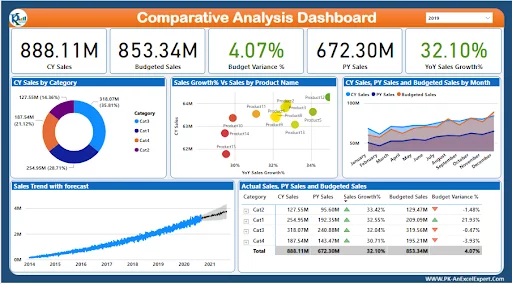
Power BI is a visualisation and Business Intelligence (BI) tool from Microsoft, aimed at helping turn data into insights.
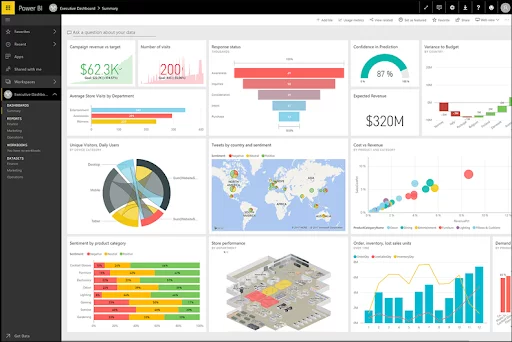
Power BI allows you to stitch together data from across your organisation and create beautiful reports and dashboards.
You can connect hundreds of data sources in Power BI, including many competitor services to Microsoft.
The Components of Power BI
There are 3 main components of Power BI:
-
Power BI Desktop
Power BI Desktop is a Windows application that allows you to build reports, dashboards and analyse data.
-
Power BI Services
Power BI Services is a cloud-based Software as a Service (SaaS) application. It extends the reporting that is created by adding secured sharing (dynamic row-level security), refreshes, and various other functionality.
-
Power BI Mobile
Power BI Mobile allows you to view any of your reporting through your phone.

Comparing Power BI vs Excel
There are a great many similarities between Power BI and Excel.
Excel is a great tool for doing calculations and things like budgets.
Excel can do some basic reporting with pivot tables and charts but is not designed for reporting.
Reporting is where Power BI comes into its own.
Not only can you create beautiful visualisations (see this article for customising your Power BI themes), but the user interface allows users to interact with the data with things like the tree decomposition visual. This enables users to draw many more insights from the data.
Power BI is also much more robust for building reports and dashboards than Excel.
For a more detailed description of the differences between Power BI and Excel, you can look here.
Competitors To Power BI
Power BI has many competitors offering reporting and BI tools. Each has its own pros and cons.
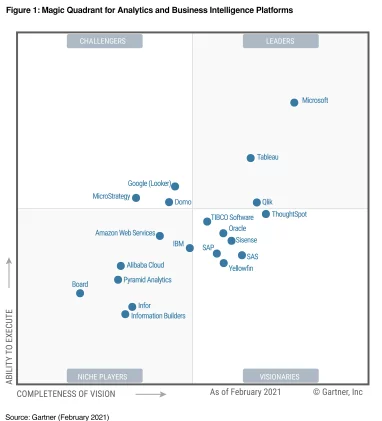
Some of the most widely used tools include Google Data Studio, Tableau, Qlik, Domo and MicroStrategy.
Below is Gartner’s Magic Quadrant report that they produce every year, showcasing in their view the leaders in the Analytics and Business Intelligence space.
Practical Use Cases For Power BI
There are many great use cases for Power BI that cover different industries and roles, let’s walk through a few of them.
Scenario 1: An Organisation That Uses Excel For Reporting
One scenario is you work in an organisation that has done all of its reporting in Excel in the past.
Your reports are manually generated or updated and emailed around each day, week or month. This is a very typical situation.
Power BI is great in this situation. In fairly short order, you will be able to connect the variety of spreadsheets, as well as other data sources via API to Power BI and to create reports and dashboards.
Power BI will also ensure that confidential data is far more secure and confidential than simply emailing spreadsheets.
Scenario 2: An Organisation With Lots Of Reporting Tools
Another common scenario is an organisation that uses a number of reporting tools. This can happen when a number of different IT systems are implemented which each has it’s on reporting tool.
This means that you have to go into each system to view reports in isolation, or worse, export the data and create a summary report.
Power BI makes connecting to multiple systems simultaneously easy. You can also generate reports by directly connecting to the data source (for example, connecting to a SQL server or Google Data Studio).
The biggest benefit here is being able to schedule the refresh of your data loads without having to export or import data, although manually exporting to PowerPoint and other Office applications is very simple, as you’d expect from a Microsoft product.
The value of Power BI is not just for people analysing data, it is for every decision-maker as well.
Imagine having a link to your own report or dashboard that has been created from many different data sources.
It not only contains the information you need, but is also refreshed daily (or potentially more often), easy to navigate and is simple for you to explain and share with others.
Enabling others to explore data in a simple way is one of the first steps to becoming a data-driven organisation.
Scenario 3: Getting Started With Power BI
Power BI is also a great tool for anyone or any business trying to learn business intelligence and analytics.
Since it is a free tool (initially), anyone with a Windows computer can run it. With its similar feel to Excel, users that currently create reports in Excel will have an easier time picking up Power BI and very sooner be doing things like combining and merging data using merge queries or manipulating difficult date formats.
However, Power BI comes with a number of different licences. More powerful Power BI licences allow you to do more with your data. This means that Power BI can very easily adapt with an organisation as it develops its business intelligence capabilities.
In its most advanced offering Power BI offers automated machine learning capabilities.
Different Components of Power BI
For anyone new to Power BI, there will likely be some unfamiliar terminology:
- Power Query: A tool used to transform your data and prep it to be used in reporting
- DAX: Stands for Data Analysis Expressions, and it is the language you write formulas in.
- Measures: Similar to calculated fields in Excel, they allow for dynamic results based on how you interact with the report.
- Interactions: The ability to click on, drill into and slice reports to uncover additional insights.
- Slicer: The equivalent to a filter.
- Data Model: The ability to transform your data, connect it with other datasets and build relationships between your data.
- Power Query: For data processing & management
- Power Pivot: For data modelling & calculations
- Power BI Visuals: For data visualisation and interactions (for example the Q&A visual, or the smart narrative visual)
It is worth noting that there is also a Power BI marketplace that contains other visuals (EG Gantt charts), add-ons and apps produced by third-party developers for Power BI.
See this article for the differences when comparing Power BI dashboards vs Power BI reports.
Power BI Vs Competitors
Power BI compares well to other competitors in the business intelligence market.
We are writing a series of articles to cover this:
How Do I Get Started With Power BI?
Following are the steps that are used to download Power BI.
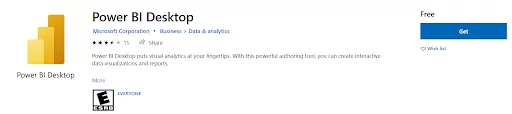
1. Download Power BI Desktop installation file from Microsoft’s website.
2. You will be taken to the Microsoft Store, click “Get”
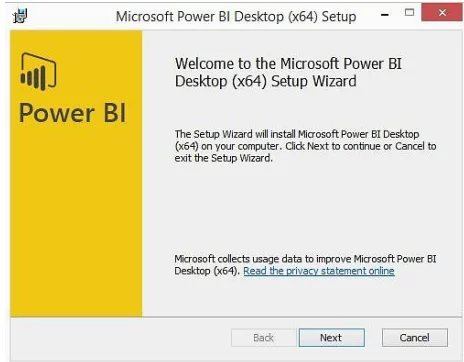
3. Launch the installer by double-clicking on it. Click next to continue
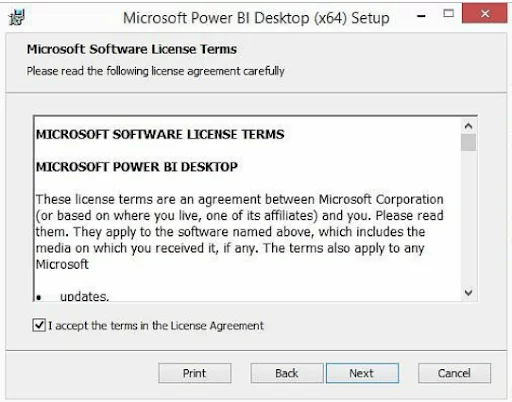
4. Read and accept the terms in the License Agreement. Click next to continue.
Note: Before Power BI download make sure that your system match the same bit system, if your system is 64-bit operating system then go for 64 bit Power BI download setup.

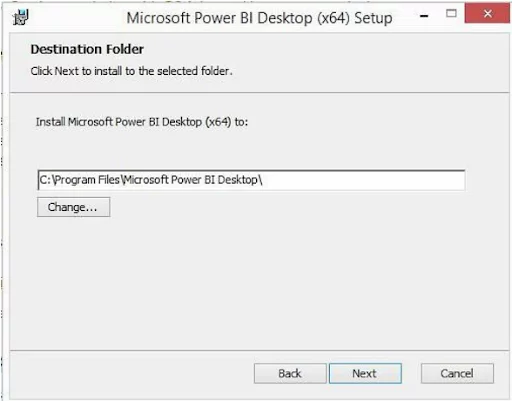
5. Select the installation folder and click next to continue.
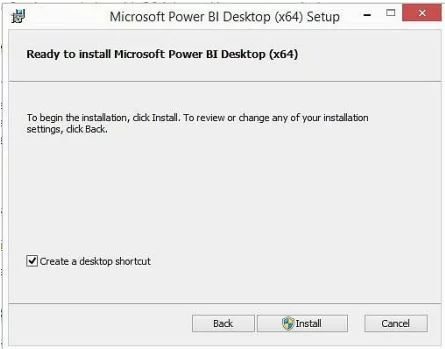
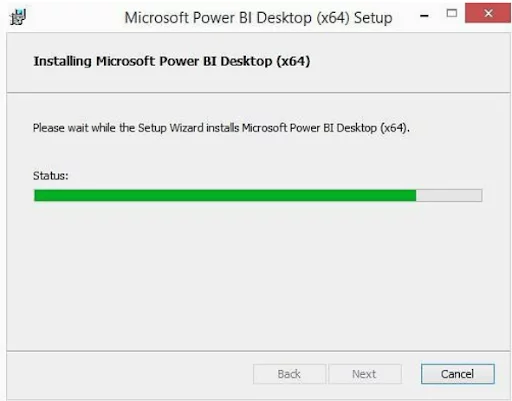
6. Click Install to begin the installation and follow the process through to completion.
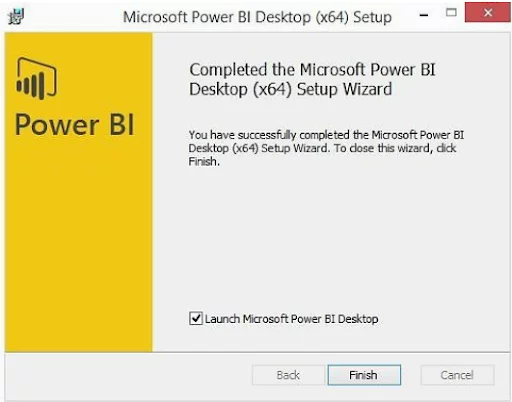
7. Click Finish to close the setup and launch the application.
When Power BI is downloaded, just double-click on the Power BI icon to open the software.
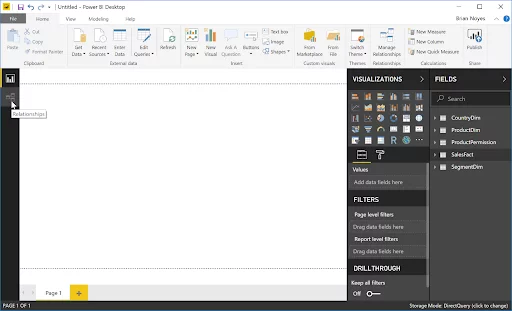
8. Once Power BI loads, you are ready to go and start creating your first report.


- Facebook: https://www.facebook.com/profile.php?id=100066814899655
- X (Twitter): https://twitter.com/AcuityTraining
- LinkedIn: https://www.linkedin.com/company/acuity-training/