
Export From Power BI to PowerPoint Safely! [Quick Guide]
Contents
One of Power BI’s great strengths is how easy it makes sharing dashboards and reports but there are occasions when you don’t want to.
This article explains how to export Power BI to PowerPoint using Power BI Service.
You will see the two most commonly used methods to convert Power BI Report pages to PowerPoint slides:
- Direct export, and
- Copy / paste.
Power BI Desktop only allows you to export Power BI reports to PDF. This is the licence typically used during Power BI training classes.
Power BI Services allows you to export reports as static images to Microsoft PowerPoint and PDF. See this article for more details on Power BI licences.
Why Export Power BI To PowerPoint?
Reasons you might want to export Power BI reports to PowerPoint include:
- Sharing information with people not familiar with Power BI.
- Power BI Service or Power BI desktop is not available.
- You have confidential information that cannot be shared via Power BI. See this article to learn more about Power BI security.
- You want to merge visuals from different BI tools ( Power BI, Tableau, etc.).
Sample Report to Export
Let’s first create a sample report with three pages. You will be exporting this Power BI report to PowerPoint.
You can download the dataset used to generate the sample report from this link:
https://raw.githubusercontent.com/curran/data/gh-pages/superstoreSales/superstoreSales.csv
The dataset contains sales for various products in a fictional store between the years 2009 to 2012.
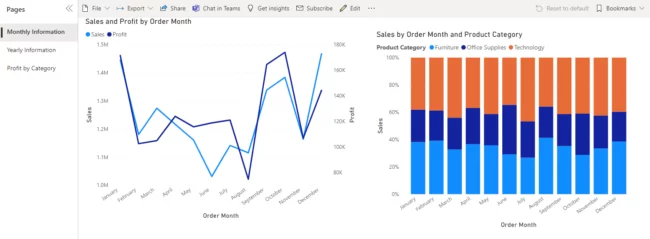
Page1: Monthly Information
This page contains a line chart and a 100% stacked column chart.
The first page of the report looks like this:
Page 2: Yearly Information
This page contains a line chart and a 100% stacked bar chart, as shown in the figure below:

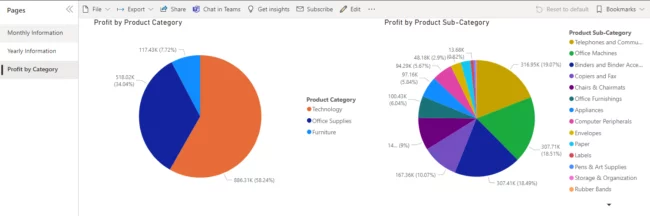
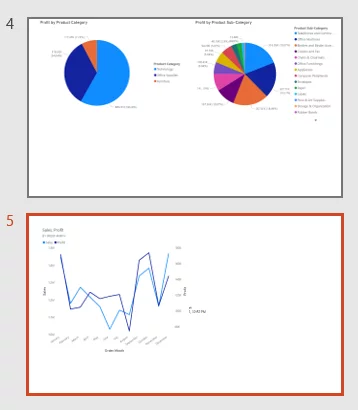
Page 3: Profit by Category
This page contains two pie charts as shown below:
Method 1: Exporting Directly from the Reports View
You can export Power BI to PowerPoint directly from the Reports View.
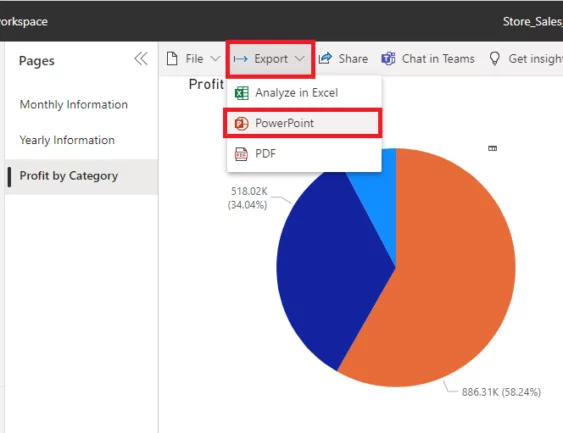
- Open any page of the report that you want to export.
- Click the “Export” link from the list of options at the top of the reports and select “PowerPoint” from the dropdown (see below).
You will see this screen.
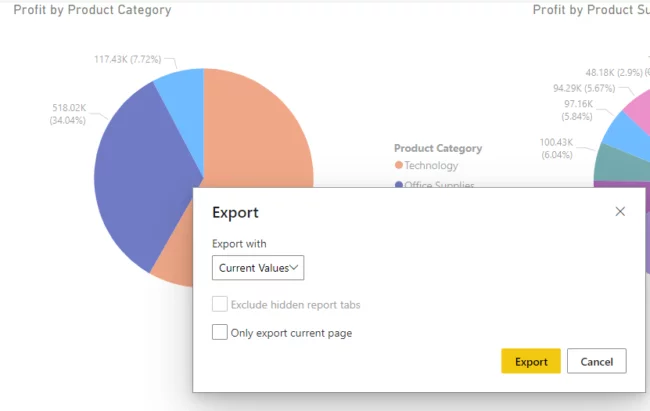
- If you only want to export the currently open page of the report, tick the “Only export current page” option.
If you want to export all the report pages, leave this checkbox unchecked.
If you have any hidden pages or report tabs, the checkbox for the “Exclude hidden report tabs” will be enabled. Check this box if you don’t want to export the hidden tabs from your report.
- Click the “Export” button on the following screen to export Power BI to PowerPoint.
Power BI will create a PowerPoint slide with the name of your report.
If you open the PowerPoint document, you will see that it contains a title slide plus one slide for each of the pages in your Power BI report.
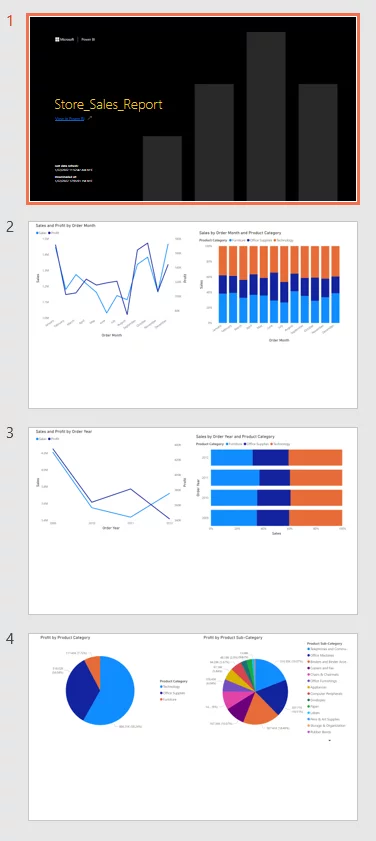
Our example Power BI report had three pages. The newly created PowerPoint will have four slides; a title slide and three content slides.
If you look at the title slide, you will see that it contains a link to the original Power BI report.

Method 2: Manually Copying & Pasting Visuals from Reports
The second option is a little crude.
You simply copy the visuals from your Power BI reports and manually paste them into any application, including the PowerPoint.
This method can be slow with extensive reports.
You have to copy and paste the visuals one-by-one from your report.
An advantage of this method is that you can copy and paste the visuals of your choice. You can also select where in your slides the visuals are shown.
To copy a visual, click on the copy icon from the top right corner of a visual, as shown below:
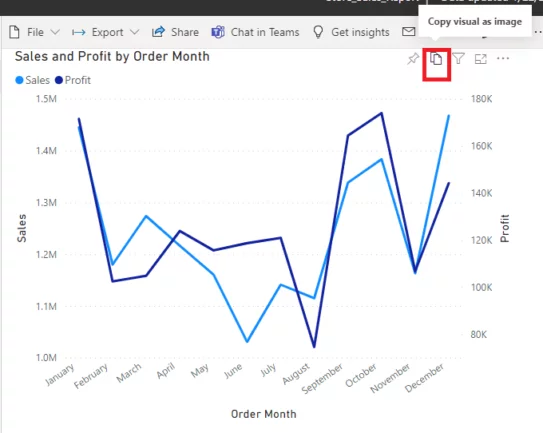
You will see the following screen. Here click the “Copy to clipboard” button.

Finally, paste the copied visual into your PowerPoint slides.
As an example, see the screenshot below:
Three Things To Remember
- When you export Power BI to PowerPoint, the reports export as static images, they are not interactive like Power BI report pages.
- Another limitation of exporting Power BI to PowerPoint is that this functionality is not available in Power BI Desktop.
- You must use a manual snipping tool to snip a report visual and paste it to a PowerPoint slide when using Power BI desktop.
Final Thoughts
Exporting from Power BI to PowerPoint is very straightforward.
Hopefully, this tutorial has helped show you how!


- Facebook: https://www.facebook.com/profile.php?id=100066814899655
- X (Twitter): https://twitter.com/AcuityTraining
- LinkedIn: https://www.linkedin.com/company/acuity-training/