
Understanding Merge Queries & Append Queries [Power BI Guide]
Contents
In this article, we will walk step-by-step through how to use Power BI merge queries, and Power BI append queries to combine data or for data preparation.
You will also learn to use fuzzy matching features when merging queries in Power BI.
If you would like to learn more about merging data in Power BI it is covered on our Power BI training courses.
What Is Merging And Appending?
Power BI’s merging and appending operations allow you to join data from multiple tables.
The choice between the merge and append queries depends upon the type of concatenation you want to carry out.
Merge operations:
Merge operations join multiple datasets or tables horizontally based on some common criteria between the tables.
This means that data is added to the matching rows in the base or first table from the second and subsequent tables.
If you select the default merge operation, your base or primary table will have the same number of rows at the end of the process as it did at the start, but each row will contain a new column or new columns.
However, this will not be the case if you choose a different type of merge. The default merge operates in the same way as a left outer join in SQL.
Append operations:
Append operations join two or more tables vertically.
The data rows from one table are appended (or added) at the end of the data rows in another table where the column values match.
So in an append operation, the base table will have the same number of columns at the end of the operations as it did at the start, but each column will contain more rows.
Let’s see examples of Power BI merge and append queries.
A Simple Merge Query
In this example, we will be using the movie lens dataset downloadable from this link as our data source.
https://grouplens.org/datasets/movielens/latest/
The dataset contains ratings for 9,000 movies by 7,000 different users. The total number of ratings is 100,836.
Download the compressed file for the dataset and extract it. You will be working with the movies.csv and ratings.csv files only.
Import the dataset in reports view in Power BI Desktop.
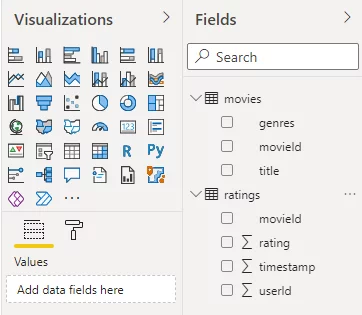
You should see two tables – movies and ratings – in your reports view, corresponding to the two CSV files you imported.
The movies table contains three columns: genres, movieid, and title.
The ratings table contains movieid, rating, timestamp, and userid.
We will create a new table containing all the ratings table columns and multiple columns (title and genres) from the movies table using Power BI merge tables queries.
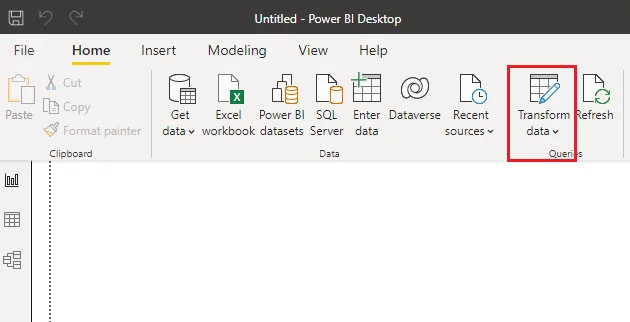
To use the merge and append queries feature, you need to open the Power BI query editor.
You can do so by clicking the Transform data option from the top menu ribbon.
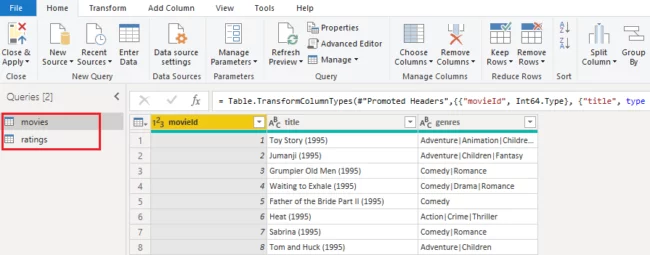
Next, open the Power Query editor.
You will see the window below. You can see that the movies table is selected by default as it is greyed out.
We want to merge the ratings and movies tables based on the common column movieid.
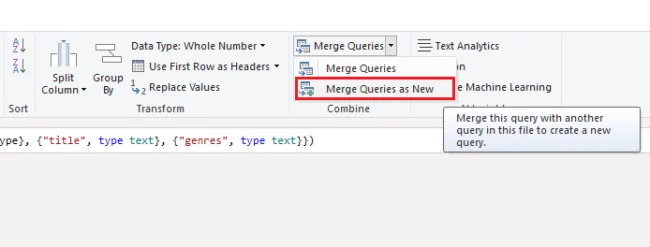
To do this, click the ratings table.
Select the Merge Queries drop-down list from the ribbon, and then select Merge Queries as New option.
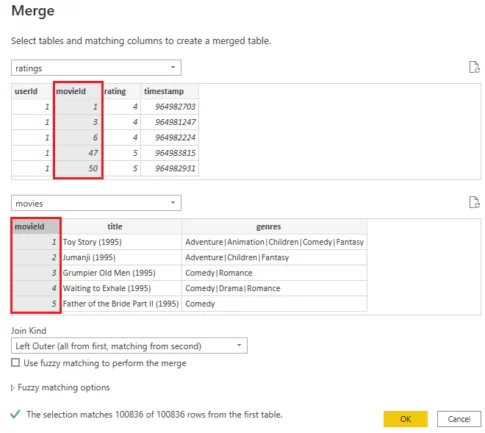
The Merge window, shown below, will appear.
By default, you will see that the ratings table is selected at the top of the screen.
The drop-down list below that contains the list of other tables is just below that.
Use it to select the movies table – in this case, the only other option!
You will see the columns from both tables now.
Select the movieid columns from both the tables and click the OK button.
Your new table should look like this.
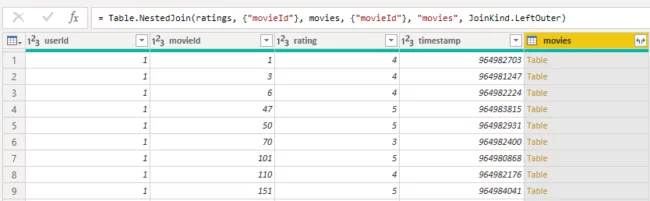
If you look at the movies column in the above figure, you can see that its rows do not contain any values. Instead, you can see Table objects.
To see the actual columns from the movies table, click the expand button (two arrows pointing away from each other) in the top right corner of the movies column header, as shown below.
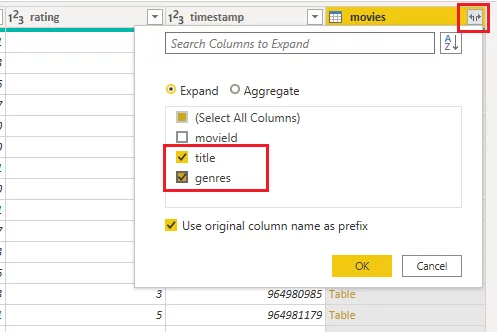
Select the columns you want to include in the expanded table and click the OK button.
For this example, we have selected the title and genres columns.
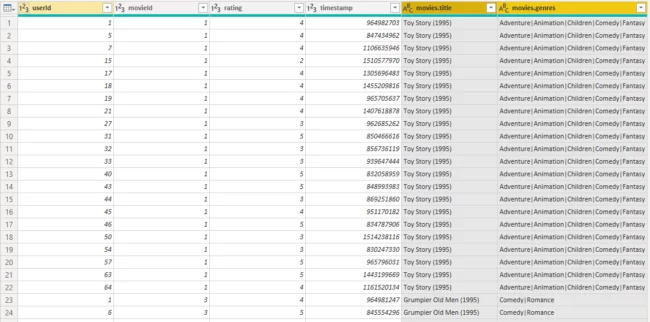
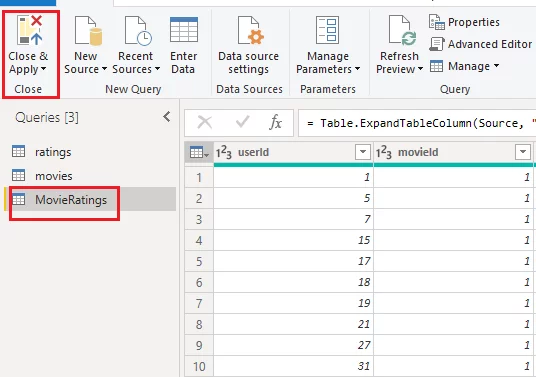
You can see that the new table now contains the movies_title and movies_genres columns, along with all the columns from the ratings table.
You can rename your newly created table by entering the table name in the Properties field on the right-hand side of the Power Query editor.
We have named the new merged table as MovieRatings.

Finally, to save the newly merged table and go back to the reports view, click the Close & Apply option from the top menu ribbon.
Merging Using Fuzzy Matching
The fuzzy matching option in Power BI lets you merge two or more tables based on partial matching between the text items from the common columns used for merging two different tables.
Fuzzy matching is best explained with the help of a simple example.
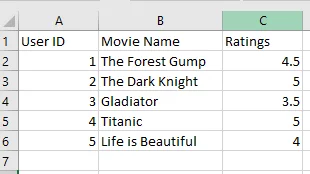
The following CSV file named Movies1.csv contains a column Movie Name which contains names of movies.
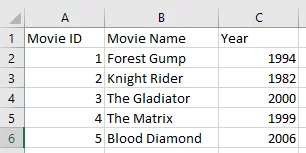
The following CSV file named Movies2.csv also contains a Movie Name column, which contains movie names.
You can see that some movie names in the Movie Name columns in Movies1.csv and Movies2.csv are not precisely the same but very similar and clearly refer to the same film.
For example, the Movies1.csv file contains the movie names The Forest Gump and Gladiator, which are very similar to Forrest Gump and The Gladiator in the Movie Name column of the Movies2.csv file.
If you used Power BI merge queries to merge the two tables based on the Movie Name columns from the Movies1.csv and Movies2.csv files, none of the records would be matched.
This is where fuzzy matching comes into play.
Fuzzy matching lets you merge tables based on partial matching between the items from the matching column between the two tables.
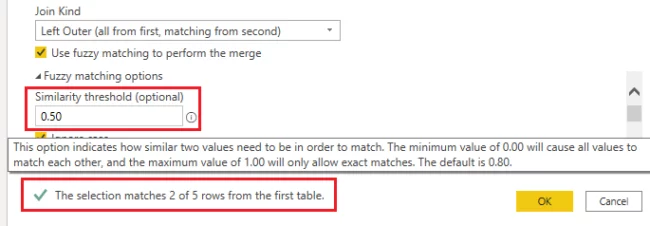
To apply fuzzy matching, you just have to select the checkbox for the option Use fuzzy matching to perform the merge.
You can find this halfway down the following screenshot, where the Movies1 and title and genres tables are being merged.
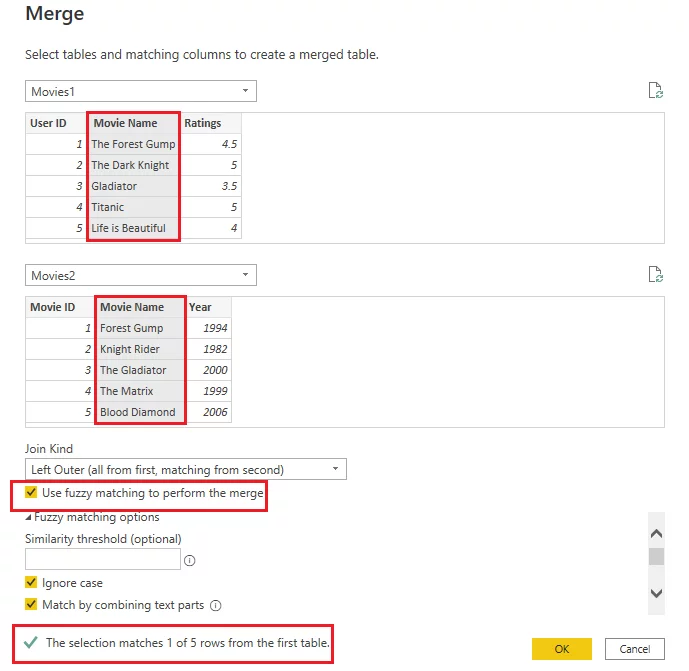
The default threshold for matching is 0.80. This figure means that Power BI will merge records if the text between the matching columns is 80% similar.
From the bottom of the above screenshot, you can see that Power BI will merge only one record if you use an 80% matching threshold.
A similarity threshold of 1 only returns exact matches. A similarity threshold of 0 will match all the records, regardless of what they contain.
Let’s try lowering the matching threshold to 0.50.
You can do so by entering a value in the Similarity threshold textbox, as shown in the following screenshot.
You can see from the above screenshot that Power BI will now match two records.
Click the OK button to execute this.
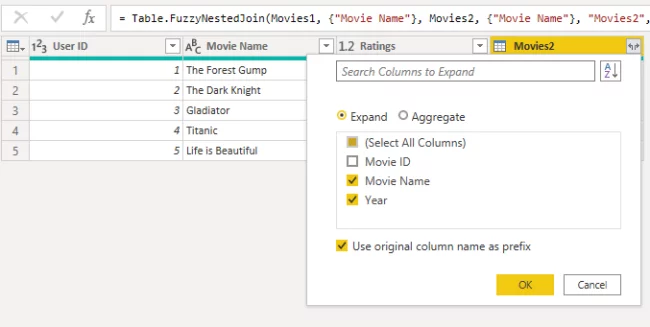
In the newly merged table, you will see the Movies2 column containing the matched records.
Expand the Movies2 column and select the Movie Name and Year columns.
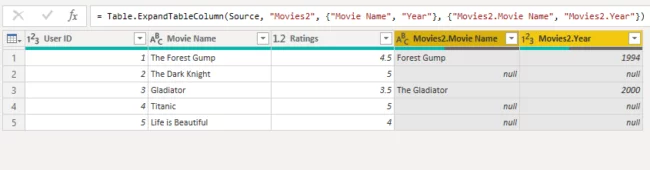
The output below shows that the two records matched from the Movies2 table using fuzzy matching are Forest Gump and Gladiator.
For the remaining rows, a null value is added in the columns from the Movies2 table for the remaining rows.
If you lower the similarity threshold further, more records will be matched.
Simple Example of an Append Query in Power BI
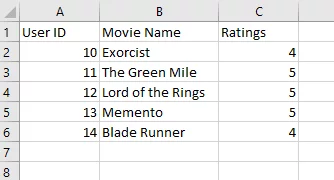
In this section, you will be vertically appending the Movies1.csv file (which you saw in the previous section) and the Movies3.csv file that looks like the one in the following screenshot.
To use append queries, open the Power Query editor.
Next, open the Power Query editor and select the Movies1 table.
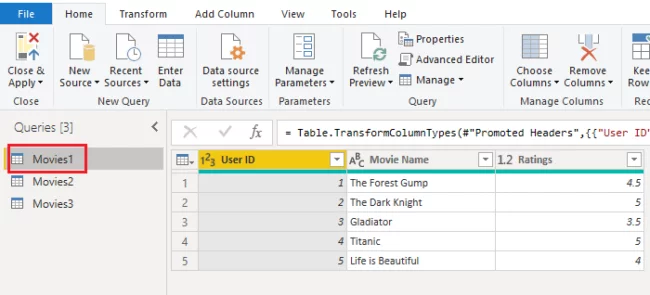
Next, from the top menu ribbon select the Append Queries dropdown and click the Append Queries as New option. 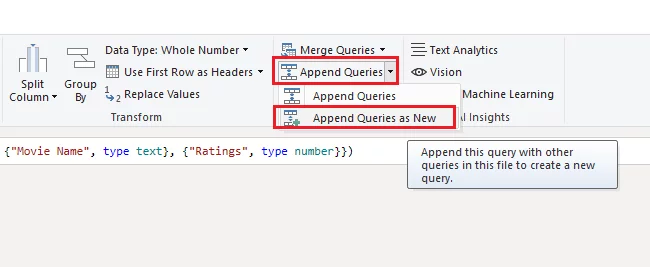
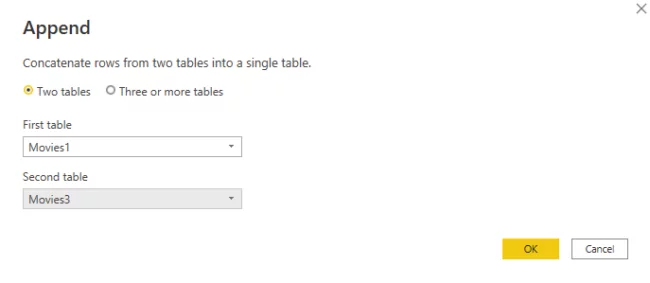
You will see the Append window, as shown below.
Here you can append two or more tables.
To append two tables, select the corresponding radio button.
The Movies1 table will be selected by default, as it was the table you picked when choosing the append queries option.
Select the Movies2 table in the Second table drop-down list and click OK.
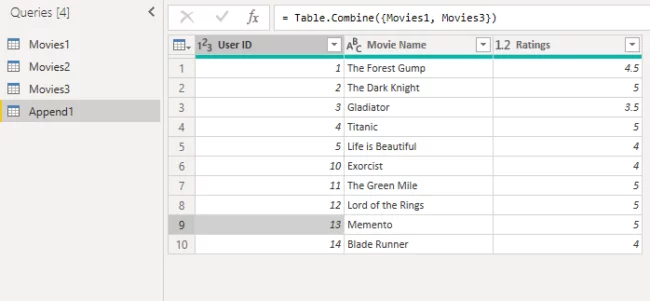
You can see that rows from the Movies2 table are now appended below the rows of the Movies1 table.
If you want to append multiple tables, you must select the Three or more tables radio button.
In this case, the Append dialogue box will show a list of the current tables on the left of your screen.
You can select the relevant tables from the Available tables list on the left and click Add to add them to the Tables to Append list on the right, as shown below. 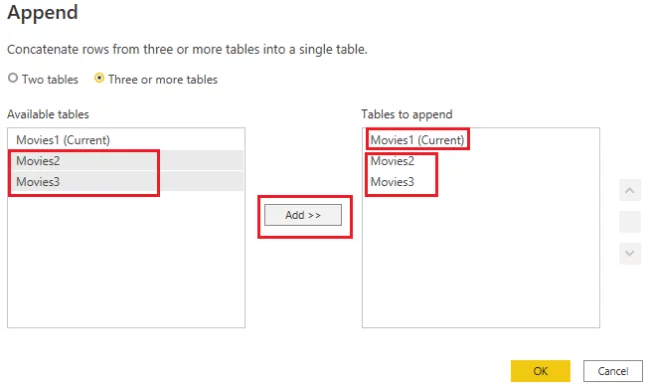
Conclusion
Power BI merge queries and append queries are very handy for concatenating data from multiple datasets or tables when you are preparing your data.
A good example would be when working with dates in Power BI.
The fuzzy matching feature makes merge queries even more powerful by allowing you to merge tables based on partial matches, and is a big advantage that Power BI has over Google Data Studio, SSRS and other rival products which often don’t do this as efficiently.
Learning to use them is key to becoming a better data scientist / big data expert.
Articles On Power BI Visuals


- Facebook: https://www.facebook.com/profile.php?id=100066814899655
- X (Twitter): https://twitter.com/AcuityTraining
- LinkedIn: https://www.linkedin.com/company/acuity-training/