
Power BI vs Google Data Studio – Which To Pick!
Contents
Power BI and Google Data Studio are both great visualisation and analytics tools.
But which should you pick up, and why?
The main difference is that Power BI is built for enterprise level analysis.
While Google Data Studio is better suited for individual, smaller scale projects.
This is why we offer Power BI training in London, learning it will get your foot in the door of many businesses.
Comparing Power BI Vs Google Data Studio
Power BI and Google Data Studio allow you to integrate and visualise data, but do so in quite different ways.
Setup
Power BI has a number of different offerings, as mentioned above where we discussed licencing.
The basic installation of Power BI is a desktop application that you install on your desktop.
Installing Power BI is quick and straightforward provided you have a modern PC with 4Gb of RAM (ideally 8 Gb) and running Windows 8 or later.
Power BI is a Microsoft product, and so unsurprisingly isn’t available for Macs.
There is only one offering of Google Data Studio, and it is completely web-based, meaning you do not need to install anything on your computer.
You log in to Google Data Studio in the same way as you do any Google product.
Data Sources
Power BI connects to a wide variety and ever-expanding list of data sources with pre-built connectors.
Update: Power BI now has a Google Sheets connector, so you can access your Google Sheets data in Power BI.
In addition, web connectors are available, so you can import data from SQL and other data sources.
Google Data Studio’s list of data sources is much smaller.
Google Data Studio offers 18 connectors built by Google, most of which are for other Google Services. There are also 400+ connectors built by Data Studio Partners.
Browsing through the connectors list, you will start to see that the connectors are predominantly for advertising, media, and content-related data sources.
Ease of Use
Power BI is very similar to Excel, something that almost all data professionals are already very comfortable with.
Its interface uses a menu and ribbons, and so most people find it very easy to navigate.
Despite this, learning to use Power BI still takes some time, as there are substantially more options and features in Power BI than Excel.
Creating a basic report is straightforward for Excel veterans, but creating something engaging and beautiful will take practice. The good news is that there is lots of helpful content online to help.
Google Data Studio is very simple to use. The user interface offers drag and drop functionality, and the limited options are intuitively laid out.
As there aren’t many bells and whistles in Google Data Studio, becoming proficient is significantly easier than Power BI.
Data Visualisations
Power BI offers a huge range of data visualisations, like bar charts, line graphs, tree visuals and maps.
It even has natural language processing visuals, like the Q & A visual and the smart narrative visual, that can generate visualisations from a text input.
In addition, Power BI has a marketplace with roughly 350 additional data visualisations that you can bring into your reports.
Since many of the additional visuals are created by the Power BI community, this number will continue to grow over time.
Creating your own custom visuals is also possible if you have a unique problem or use case.
Like Power BI, Google Data Studio comes with basic visualisations included as standard.
The big difference is that it does not benefit from a marketplace, so Google Data Studio has far fewer additional visualisations to choose from.
Security
Power BI comes with robust security as standard.
You can integrate with Active Directory in the enterprise version, creating a seamless login and navigation experience for users.
This integration also allows for advanced features like row-level security, allowing a user only to see data that is meant for their eyes.
Google Data Studio’s security features are minimal by comparison.
For each user, you can assign them a role that can either view or edit any report. Allocating roles is the full extent of Data Studio’s security features.
Cost
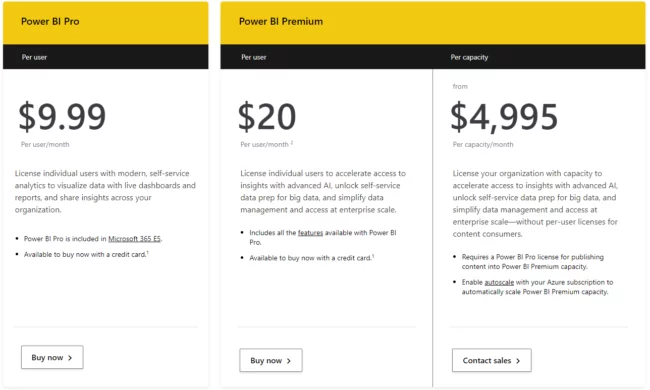
Power BI offers four different pricing options, in addition to Power BI Desktop, which is free.
The options range from Power BI Desktop, the free version, all the way through to the enterprise version, which costs thousands of dollars per month and provides a complete big data solution for running a real-time data warehouse.
The best part about Google Data Studio is that it is entirely free to use, and so you can build reports and share your work, all without paying anything.
Who is Power BI Best For?
Power BI is a great solution across the board.
It has a number of offerings that are well-targeted and designed for their target markets.
For example, Power BI Desktop is an excellent solution for people just getting started with business intelligence, whereas Power BI Service works well for enterprises with large-scale data practices.
The variety of offerings means that Microsoft Power BI can grow with you as a user or an organisation, and provide the functionality needed at all points along the journey.
Who is Google Data Studio Best For?
Google Data Studio is more of a niche tool than a go-to solution.
There are three key areas where it makes sense.
1 – Your organisation predominately uses Google Analytics or similar advertising and media metrics.
2 – You work with small amounts of data.
3 – You work for a relatively small organisation that uses Google apps rather than Microsoft Office.
Google Data studio works wonderfully in conjunction with Google apps as a simple way to visualise data in the Google ecosystem.
On the other end of the spectrum, Microsoft Fabric offers a far more complex suite of tools, that far expand on what Power BI can do.
Final Thoughts
There is no “one size fits all” solution when it comes to business intelligence.
It never hurts to try different tools as a data user, and both Power BI and Google Data Studio are great additions to your toolbelt.
Power BI is a much more feature-rich tool, but that also comes with complexity and some cost.
Ultimately, the main difference is that Google Data Studio is free, and Power BI is paid for (for pro versions).
As you’d expect, Google Data Studio is pretty good but far more limited than Power BI which is enterprise-grade BI software that you pay for.


- Facebook: https://www.facebook.com/profile.php?id=100066814899655
- X (Twitter): https://twitter.com/AcuityTraining
- LinkedIn: https://www.linkedin.com/company/acuity-training/