
[Introduction] Automated Machine Learning In Power BI
Contents
Automated machine learning is the process of automating the tasks of applying machine learning to real-world problems.
AutoML covers the complete pipeline from the raw dataset to the deployable machine learning model.
Automated Machine Learning (AutoML) in Power BI for dataflows provides data scientists with the tools needed to train, validate and deploy Machine Learning (ML) models within Power BI.
This is a great way to start playing around with machine learning and learning how to use Power BI.
To use machine learning in Power BI, you simply create a dataflow and select the training data you would like to use.
AutoML will then automatically extract the most relevant features and select a model that best fits the data.
Finally, it will tune and validate the ML Model based on your desired outcome.
One of the best parts of this workflow is that Power BI will automatically generate a performance report.
What Do You Need to Utilise AutoML?
To use AutoML, you will need a Power BI Premium subscription.
Power BI Premium is the more expensive of the two subscriptions offered under Power BI Service.
Given its cost, it is only available to enterprise Power BI users or professional business analysts.
See this article on the different Microsoft Power BI subscriptions for more details.
The ability access these types of advanced features is one of the ways that Power BI differentiates itself from products like Tableau and Google Data Studio.
You can still use AutoML if you have Azure Services. Using Azure ML will be explained at the end of the article.
There are the three models that AutoML supports:
- Binary Prediction,
- Classification, and
- Regression.
These are known as “Supervised Machine Learning Models”. They learn from data that has a known outcome or output.
For example, we can use historical data from a bicycle store that has collected data on their customers who did or did not purchase a bike.
This data set contains data collected about each customer and the known outcome (purchased or did not purchase) for each customer.
In this example, we are using a Dataflow that is already well prepared for simplicity.
For more advanced users, if you need to transform your data before using it (especially if it is natural language) for modelling.
You have access to a set of functions from Azure Cognitive services through your Power BI subscription to help with this.
The three main components of this are sentiment analysis, key phrase and extraction and language detection.

Creating The Dataflow
The first step is to have your data set ready ideally in a data model. We will be using some test data from the UC Irvine website.
Here is the raw data to use in this example: online_shopper_intention.csv
Next is to have a workspace with artificial intelligence (“AI”) capabilities enabled.
If you have not set one up, create a workspace in Power BI as usual, but before you hit ‘Save’:
Click ‘Advanced’ and make sure your Power BI licence mode is either; Premium Per User, Premium Per Capacity or Embedded.
Once the Workspace is set up, click ‘+ Create’ at the top-right of the screen and select Dataflow.
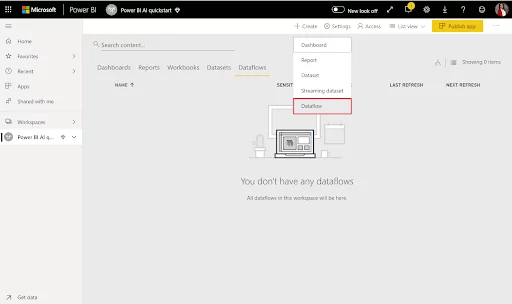
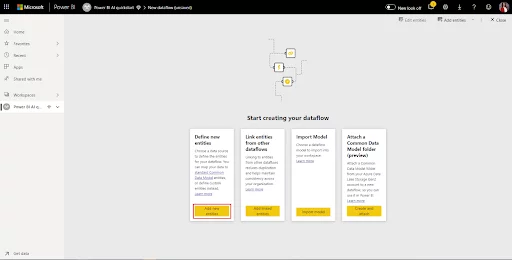
Select Add new entities. This will take you into the Power Query editor.
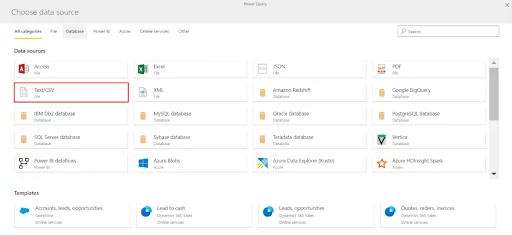
Select Text/CSV File as the data source. If you are using a different format, make sure you select the correct input.
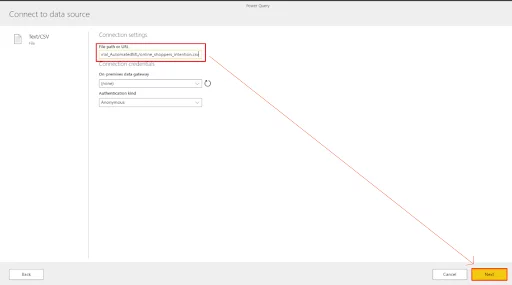
You will be presented with an option to Connect to a data source. Paste the link from above and press Next.
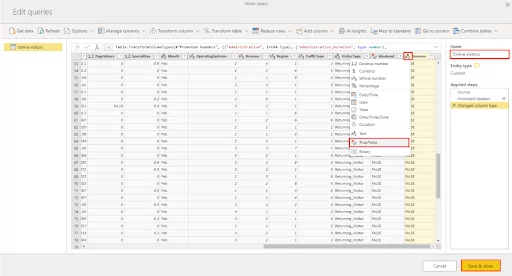
The editor will show a preview of the data from the CSV file.
If you need to transform any of your data, you can do it here before applying the ML model.
You can also rename the Query to something of your choosing, ‘Online Visitors’.
Power Query will automatically try to recognise the type of data in the columns.
We will need to manually change the ‘Revenue’ Column to True/False in this example.
Now Save & Close to apply these changes and give your new Dataflow a name.
Creating A ML Model In Power BI
Using ML in Power BI is very simple.
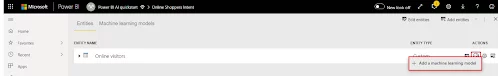
Select the Apply ML model button in the Actions section and click Add a machine learning model.
Now we specify the historical data including the outcome we want to predict.
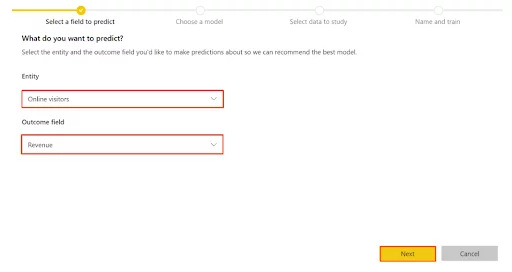
For this example, we will be using the Revenue field for the ‘outcome field’. Click Next.
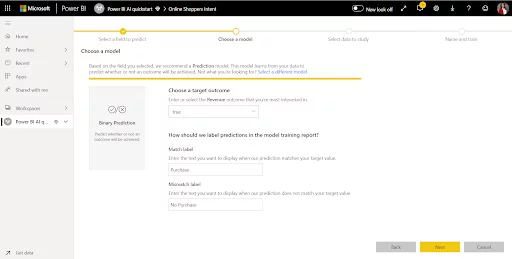
Next, Power BI will automatically determine the best model to use depending on the data supplied.
For this example, it will be a Binary Prediction as we are determining whether a customer ‘Purchased’ or ‘Did not Purchase’ a product, which is a binary True/False outcome.
You can add labels to the outcome fields to make them easier to identify. I have used ‘Purchase’ & ‘No Purchase’.
Next, Power BI will analyse the data provided again and determine what columns will be best to use for model training.
If a Column is not used Power BI gives a brief explanation as to why.
If you want to use these columns, you still can. Simply check the box.
Click Next to save the columns.
The final step is to name the model and decide how long you want the model training time to be.
The minimum model training time is 5 minutes, and the maximum is 360 Minutes. Longer train times yield better accuracy.
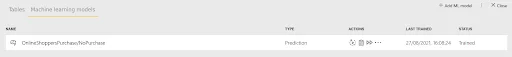
When the model has finished training, its status will show as Trained, and you can move onto the next stage, reviewing the Model Validation Report.
Model Validation Report
Now that the model has finished training, let’s take a look at the Validation Report.
In the Machine Learning Models tab, Click View training report from the Actions menu.
The report will show you key features and describe how the model will perform.
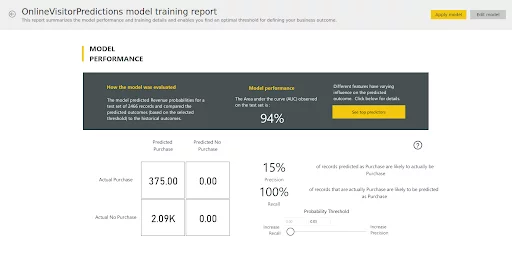
On the first page of the report, you can see an overview of the model’s performance. A Percentage indicates the model’s performance.
Using the Probability Threshold slider you can determine the model’s Recall & Precision.
Depending on your application, you may wish to have either higher Recall or Precision. Try both out!
For example, in fraud, you would want to increase the recall value to avoid missing any fraudulent activity.
From here, select See top predictors.
This will take you to a new page that shows the Key Influencers.
These are factors that were most effective in producing a high performing prediction model.
You can see the breakdown of an Influencer by clicking on it.

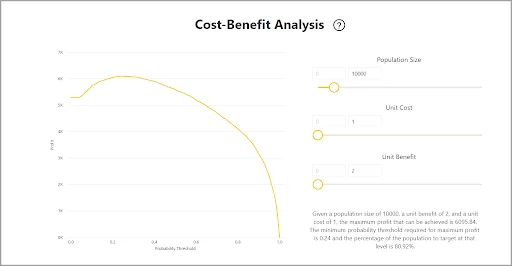
There is also a tab at the bottom of the page called Cost-Benefit Analysis which is a tool to help identify the subgroup of data that you should target to produce the highest profit.
You can specify an estimated unit cost and a unit benefit by using the sliders to the right of the graph.
Using this tool can help decide the Probability Threshold for the final model.
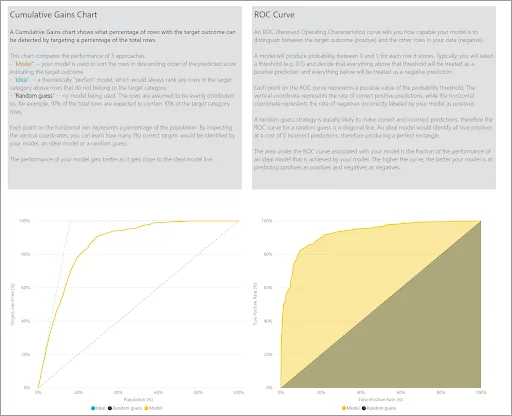
And one final tab for this particular type of ML model is the Accuracy Report. Here you can see statistical measures of the model performance; ‘Cumulative Gains Chart’ and ‘ROC Curve’.
Applying The Model
To apply the model to you first need to select apply model at the top right of your screen.
You then specify which table you want to apply this model to (input entity) and the names you wish to use for the new prediction columns.
Once completed, four new columns will be added to the enriched tables:
PredictionScore is a percentage probability, which identifies the likelihood that the target outcome will be achieved.
The Outcome column contains the predicted outcome label.
Records with probabilities exceeding the threshold are marked as “True”.
Records below the threshold are predicted as unlikely to achieve the outcome and labelled as “False”.
The PredictionExplanation column contains an explanation with the specific influence that the input features had on the PredictionScore.
Conclusion
The future of data science is in machine learning.
Power BI’s autoML functions offer a fantastic way to get started with machine learning
Give it a try and play around!
For more on Power BI, check out our this article to get 15 Power BI experts top tips, or this one to learn about Power BI relationships!


- Facebook: https://www.facebook.com/profile.php?id=100066814899655
- X (Twitter): https://twitter.com/AcuityTraining
- LinkedIn: https://www.linkedin.com/company/acuity-training/