
COMPLETE GUIDE Data Models [Power BI]
A Power BI Data model is a collection of entities (in the form of tables) connected via different types of relationships.
Data Models looks very similar to an entity relationship (ER) diagram used in database design.
We will cover the use of data models and two key methods of creating one in Power BI.
As your Power BI skills improve, and you become more advanced – data models become more and more important!
If you want a comprehensive covering of Power BI and all of its capabilities, check out our Microsoft Power BI Courses here.
Why are Data Models Important?
The advantages of using a data model when using Power BI include.
- Using a data model speeds up Power BI Data visualisation and report generation.
- Power BI publisher does not have to go through all your information if you have unnecessary columns in your data tables, as you will if you are using a flat file.
- Avoids data redundancy. For example, if you have to change the name of a product, you can update it in one place, and all the related tables will have access to the updated product name.
- Data aggregations are simpler to build, and reports and dashboards generated via data models are more accurate.
- Your reports and visualisations will be simpler to maintain.
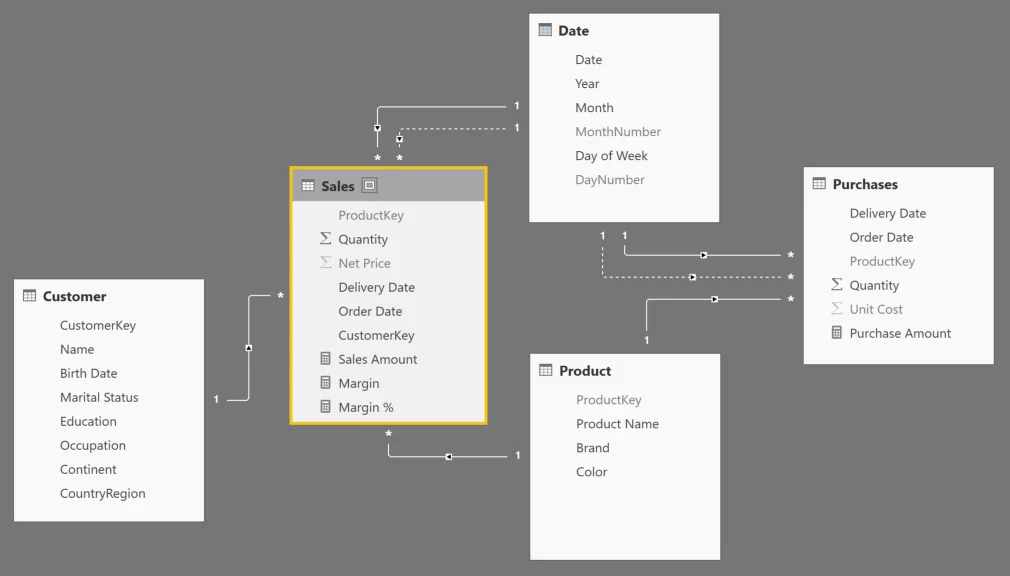
This is what a data model looks like:
How Do You Create A Data Model?
Power BI Data models can be created implicitly and manually, or explicitly.
We look at both methods below.
1. Simple Example: Implicit
Power BI automatically tries to detect relationships between different entities and tables in your dataset and creates a data model using this method.
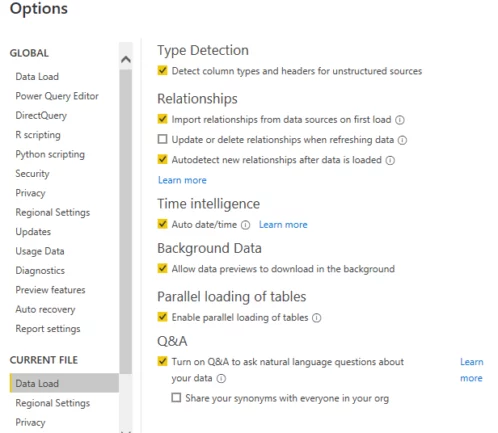
This option is enabled by default and can be accessed from the following location on your Power BI dashboard:
File -> Options and settings -> Options -> Current File -> Data load
Let’s see a simple example of how Power BI automatically tries to establish relationships between different data sources to create a data model.
You can download the sample CSV dataset used in this section from:
https://files.grouplens.org/datasets/movielens/ml-latest-small.zip
Download the dataset and upload the four CSV files: links.csv, movies.csv, ratings.csv, tags.csv.
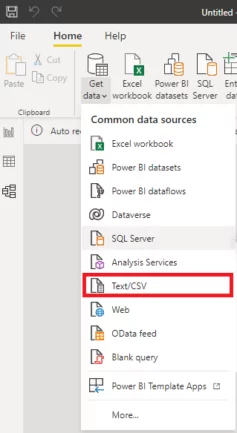
You can upload the CSV files to your Power BI dashboard by clicking the “Get data” option from the top menu and then selecting “Text/CSV” option from the dropdown list.
You will see the four CSV files in the form of tables and their corresponding columns in the Reports View as shown below:
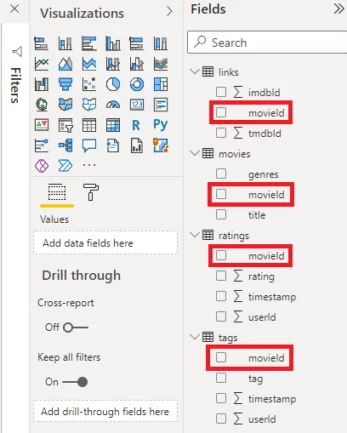
You can see from the above figure that the “movies” table contains information about movies like title, genre, movieid etc.
The “links”, “ratings”, and “tags” tables also contain a movieid column which refers to the movieid column of the movies table.
If you click the “Model” icon from the left menu bar on the Reports view, as shown in the following screenshot, the Power BI Data model will be displayed.
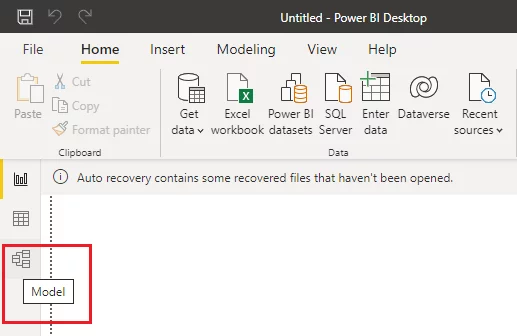
As mentioned above, a Power BI data model looks very similar to a database entity-relationship diagram.
You can see below that Power BI has automatically detected relationships between multiple tables.
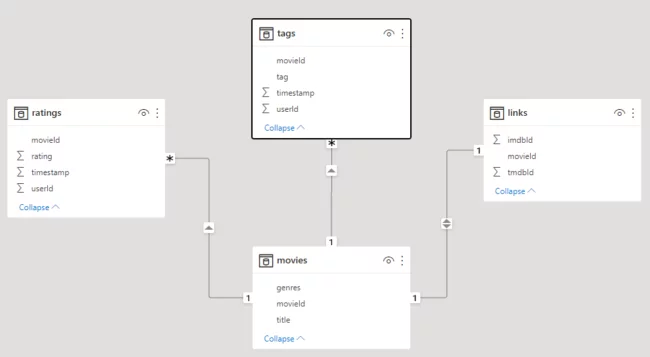
A one-to-many relation is established between the movies and tags tables and the movies and ratings tables because a movie can have many ratings, but one user rating belongs to one movie.
Similarly, a movie can have multiple tags, but a record in the tags table can only belong to one movie.
The movies and links tables have a one-to-one relationship since one link (containing the imdbid for the movie) belongs to only one movie, and one record in the movies table has only one unique imdbid.
2. Advanced Example: Explicit
In some cases, the tables in Power BI are not related to each other.
Furthermore, sometimes a single flat file contains all the data.
In these cases, you need to create a Power BI data model explicitly.
Let’s see how you do this with the help of an example.
You will be using the following CSV file as the sample dataset.
https://raw.githubusercontent.com/datasets/covid-19/main/data/time-series-19-covid-combined.csv
Import the CSV file into Power BI.
You can see the data columns in the screenshot below. Our dataset contains data on the number of confirmed Covid cases, recoveries, and deaths for different countries/states on different dates.
Instead of clicking the “Load” button in the following window, click the “Transform Data” button.

However, there is a particular problem with the above dataset.
If the name of a province/state or a country changes in future, you will have to update that state or country name in every row that it appears in, which will be time-consuming.
A better solution would be to create separate tables for country and province/state names and add the ids of the countries and state names to this original table.
This is similar to the concept of normalisation in relational databases.
Let’s see how you can do this with Power BI data models.
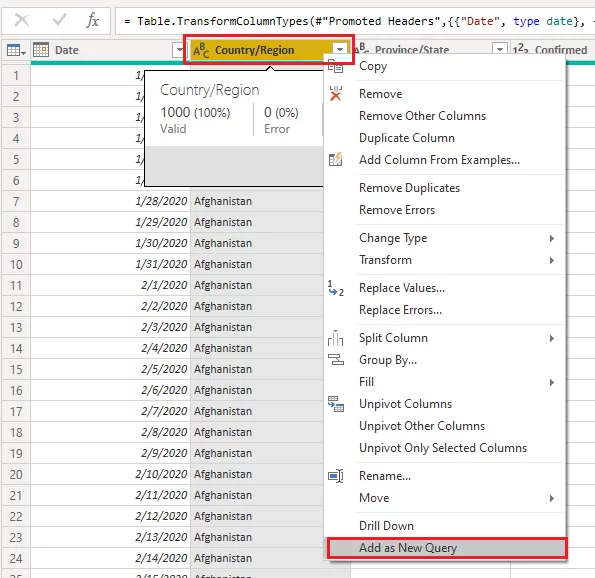
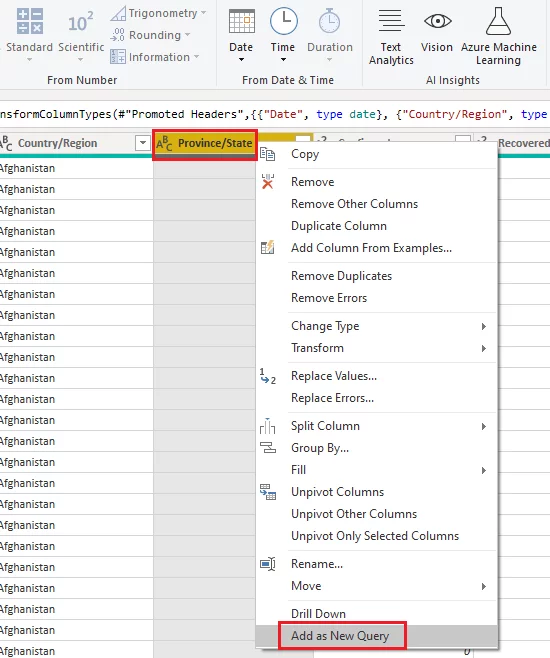
Step 1:
Right-click the “Country/Region” column header and click “Add as New Query”, as shown in the following screenshot.
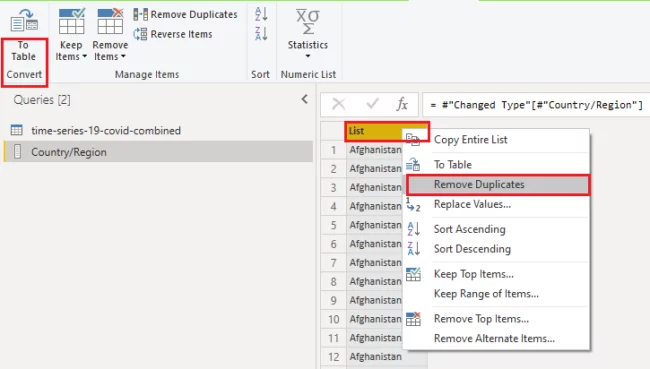
Step 2:
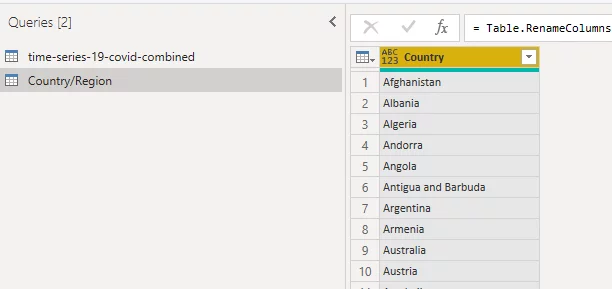
A new table will be created with a list of values.
Right-click the list header and select “Remove Duplicates”.
Also, click the “Convert To Table“ option from the top menu to convert the list to a table column.
Step 3:
Rename the column header to “Country” as shown in the screenshot below:
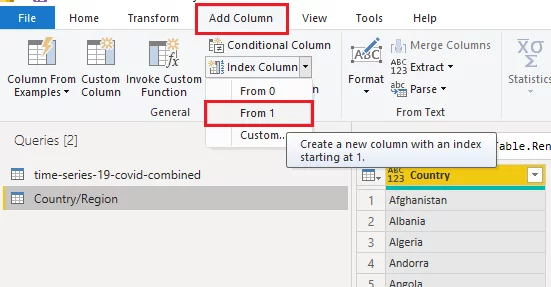
Step 4:
Add a new “Index Column” which starts from 1 to your newly created Country/Region table as shown below:
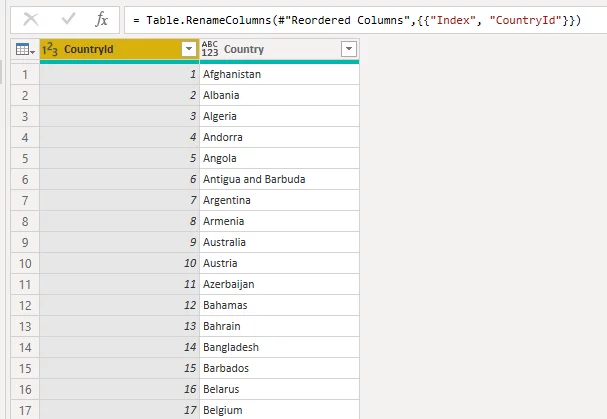
Step 5:
Finally, rename the “Index” column to “CountryId” column.
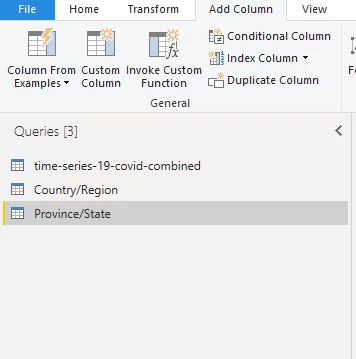
Again, perform steps 1-5 to create a new table for the “Province/State” column using the “Add as New Query” option.
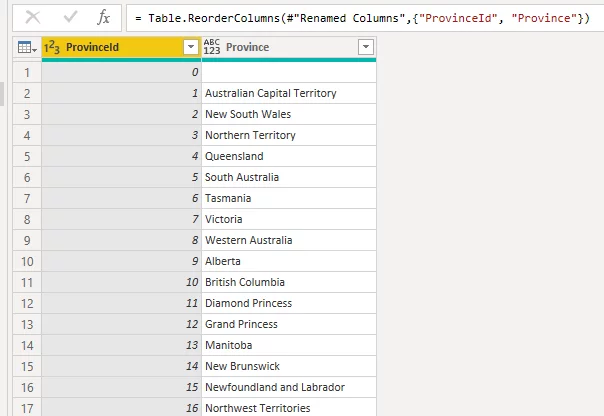
After performing steps 1-5 for the “Province/State” column in your original dataset, you should have a new table called Province/State with the following two columns (the columns are renamed).
You should have the following three tables in your dataset.
Step 6: From the original table, right-click the header of the “Country/Region” column, and click “Merge Queries” from the top menu as shown below: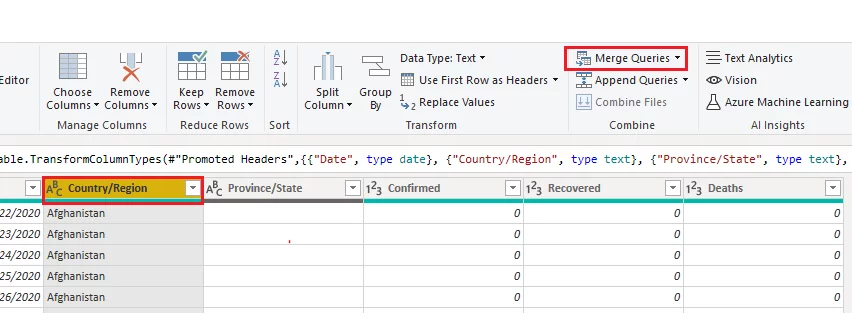
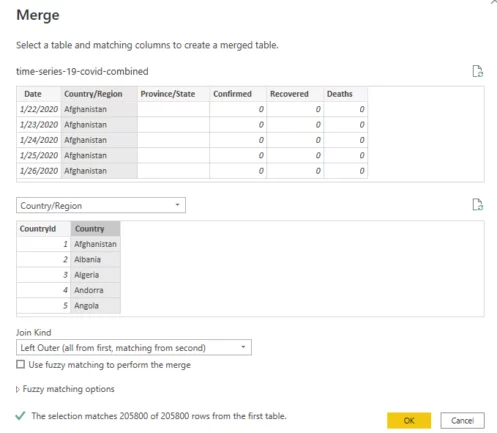
Step 7:
You will see the following window.
Here select the “Country/Region” column from the original “time-series-19-covid-combined” table and the “Country” column from the “Country/Region” table and click “OK”.
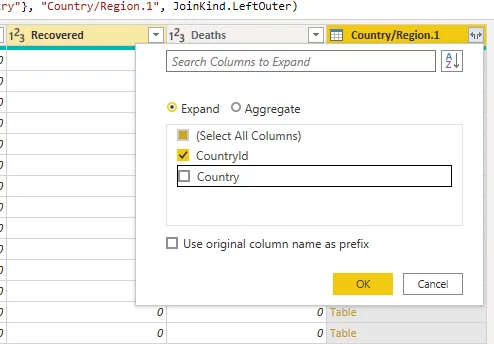
Step 8:
A new column will have been added, as shown below.
Click the top right corner of the column header. Uncheck “Country” from the list columns and click the “OK” button.
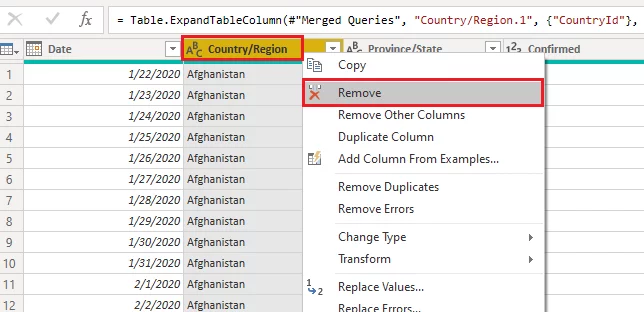
Remove the original “Country/Region” column as shown below.
In the same way, merge the “Province/State” column from the original table with the “Province” column of the “Province/State” table and then remove the “Province/State” column from the original table.
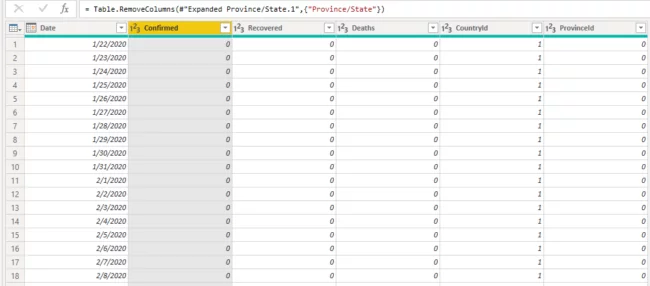
After carrying this out, your original table should look as per the below.
You can see that the “Country/Region” and “Province/State” columns have been replaced by the “CountryId” and “ProvinceId” columns.
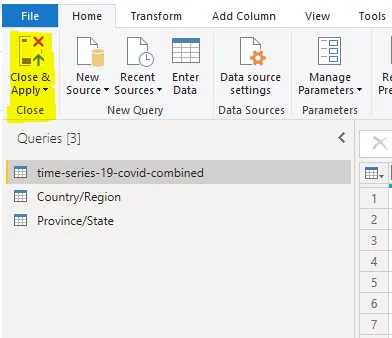
Step 9:
Finally, click the “Close & Apply” button from the top menu as shown below:
Reports view will open.
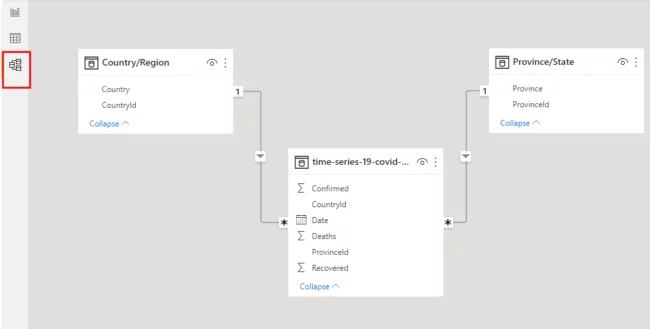
If you click the model icon from the list of options on the left, you will see your newly created Power BI data model.
You can see that the original table has a many-to-one relationship with the “Country/Region” and “Province/State”.
Conclusion
Power BI data models are extremely useful for fast data visualisation.
Data models logically divide your data into smaller tables, enforce data integrity, and avoid redundancy.
Though Power BI automatically detects relationships between different entities in a dataset, you can also create custom Power BI data models using the approach explained in this article.
If you want to learn more about Power BI, we suggest our article about Power BI datamarts where you’ll learn what they are and why you should use them.


- Facebook: https://www.facebook.com/profile.php?id=100066814899655
- X (Twitter): https://twitter.com/AcuityTraining
- LinkedIn: https://www.linkedin.com/company/acuity-training/