
How Dynamic Row Level Security Can Help You [Complete Guide]
Contents
Using dynamic role-level security, you can restrict users’ access to reports and dashboards based on their login credentials.
Row-level security is often abbreviated as RLS!
This is one of Power BI’s more advanced features that is covered in our Power BI classes.
What Is Dynamic RLS?
Row-level security allows users to see data from the same Power BI content differently.
You only assign one user to a single role using static role-level security. For more information on static row-level security, see this article: row-level security.
What if you need to assign multiple roles to a single user or multiple roles to a group of users?
Then it’s time to get a little more dynamic and use dynamic RLS.
Benefits of Dynamic RLS
Using DAX functions is the best way to limit data views across your organisation because DRLS filters the dataset based on the Power BI Service user’s log-in credentials.
It saves you the trouble of creating multiple roles for a single user, as you have to with static role level security.
Dynamic Row Level Security – Guided Example
We’ll use data entered directly into Power BI to demonstrate Dynamic RLS.
Dynamic security works with any data source that Power BI accepts, for example a SQL server.
Let’s start with Power BI desktop and create two basic tables:
- Sales Rep
- Transactions
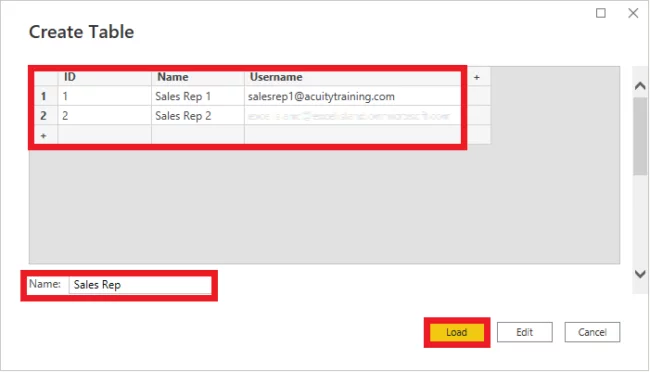
Sales Rep is a database that contains information about sales representatives and sales transaction data. It’s worth noting that a sales representative handled each transaction.
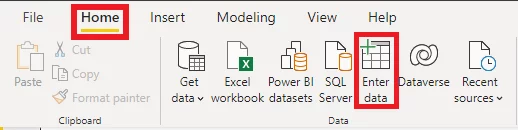
To create a new table, go to Power BI Desktop’s Home tab and click Enter Data.
Create a table with three columns with data in them, name it Sales Rep, and make sure the data in the username column is from real Power BI accounts that you want to secure. Load the table.
Create a second table with data in it and name it: Transactions.
Load the table.
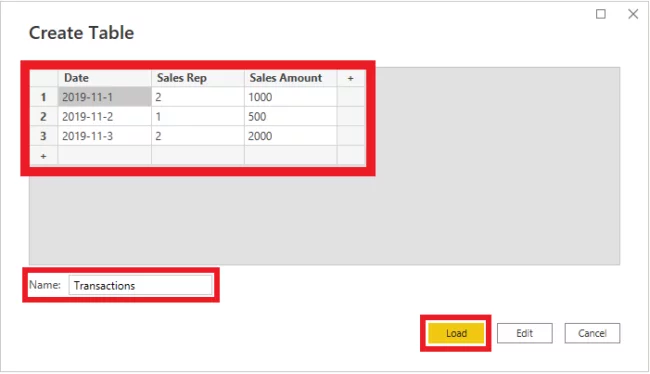
As you can see from the sample table, each sales transaction was handled by a sales rep.
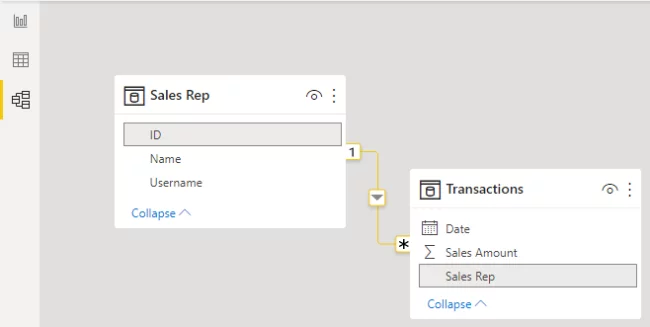
After loading both tables, double-check the relationship is between Sales Rep (ID) and Transaction (Sales Rep).
- Creating a Report
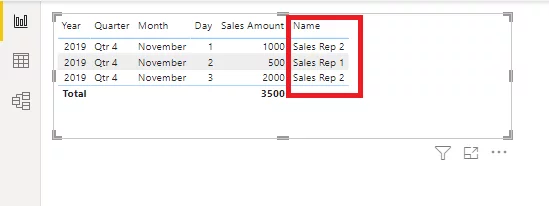
Create a table visualisation to display the date, transaction amount, and name (from the sales rep).
The simple table report below shows this.
When a user logs in, the goal is to ensure that they only see the portion of the report assigned to them based on the Sales Rep (Username).
- How to see who’s currently logged in?
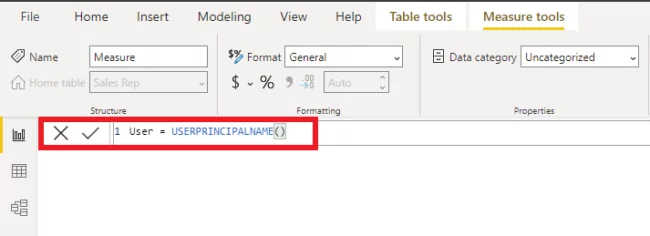
USERPRINCIPALNAME() is a useful DAX function that determines who is currently logged in and using the report.
It will help you filter the report and show reports based on who is currently logged in and viewing the report or dashboard.
Create a new measure called “User” (or whatever you want) with a value of “USERPRINCIPALNAME” by right-clicking on the column containing the users’ email addresses (as shown below).
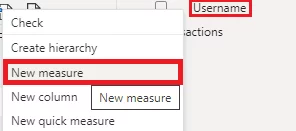
Press Enter on your keyboard.
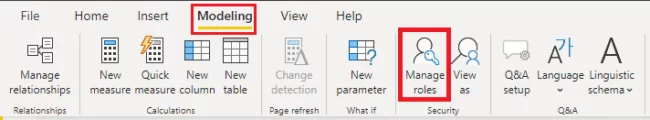
- Assigning a Role.
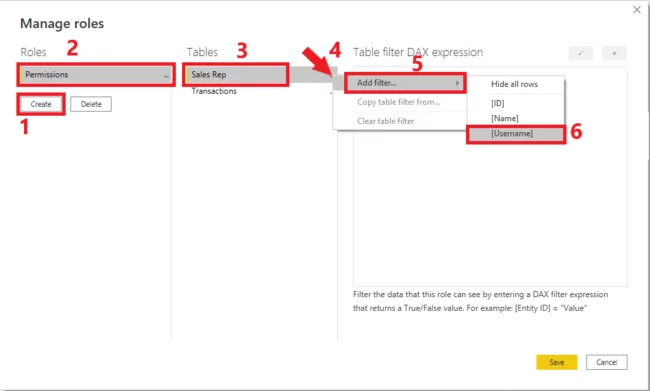
Click on the Modeling tab on the Ribbon Bar and then click Manage roles.
- Click on Create
- Assign a name to the Role.
- Find the Table and click on it.
- Select the Ellipses beside the table with your mouse.
- Apply a Filter
Choose the name of the Column you want to use.
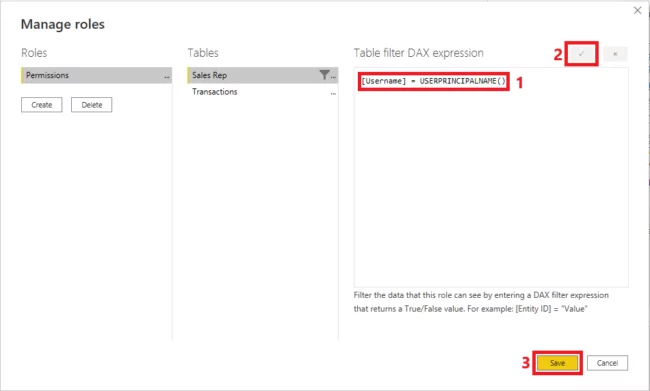
Replace [Username] = “value” with USERPRINCIPLENAME(), verify the DAX Expression for errors and finally click Save to apply the role, as shown below.
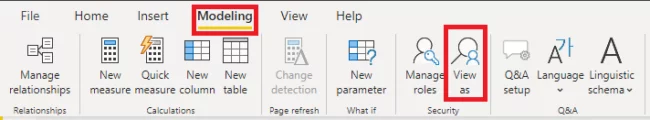
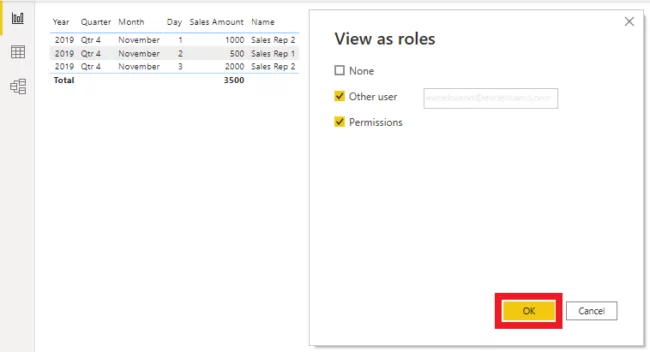
- Validating and Verifying A Role
Click “View As” on the Modelling tab to see if the role is active based on who is currently logged in.
Check the box “Other users”, and to the right, enter the email address of a user you want to test.
Below that, check the box for the newly created role “Permissions”.
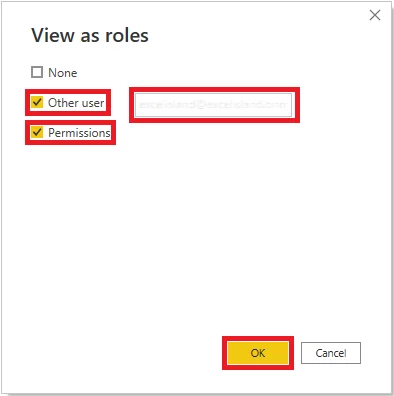
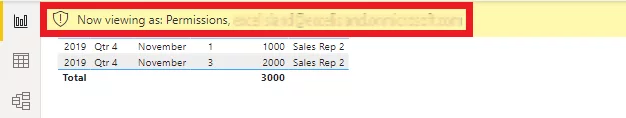
Before clicking OK, here’s a look at the report.
After you’ve clicked OK,
- Assigning Users to roles
Within Power BI Desktop, you cannot assign users to roles after you’ve published your report.
In Power BI service, you can.
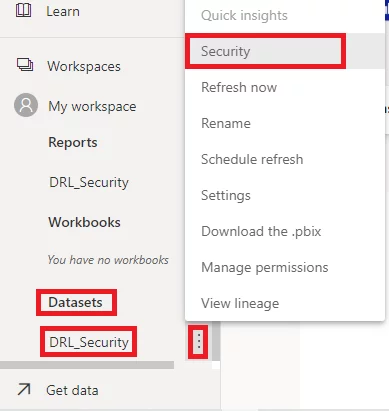
To do this, navigate to the workspace where the Dataset or Report is published.
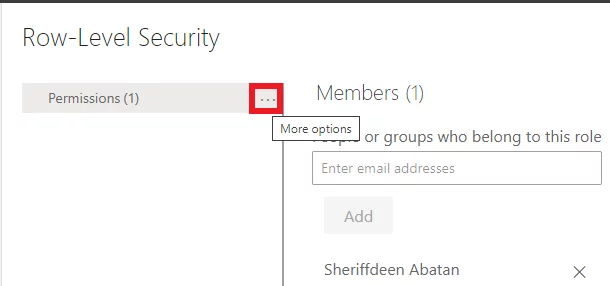
Select Security by hovering over the dataset and clicking the Ellipses.
Add all users to the Security tab.
One user, myself, has been added to the role in the screenshot.
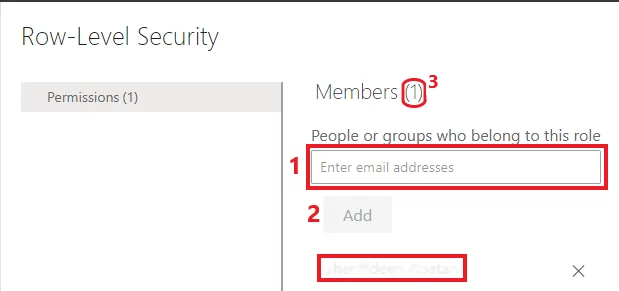
Adding a user here does not guarantee that they will see the report’s data.
Remember that this security is dynamic.
They will only see data rows assigned to their username or email if the underlying dataset contains a record for them.
Having dynamic features is part of what makes Power BI so powerful. For example, the dynamic countdown timer, which updates in real time.
Testing DRLS
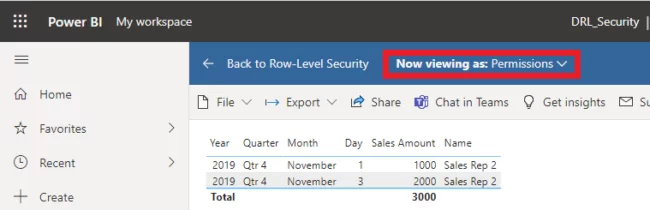
Click “Test as role” to see if the role is active on the Ellipsis next to the role name in Power BI service.
You’ll be able to see reports created specifically for this role based on the currently logged-in user.
Conclusion
Using the DAX UserPrincipalName() function, you’ve seen how simple it is to use Dynamic Row-Level Security in Power BI.
When users log in with limited access to the underlying datasets, they will see their assigned view of the reports.
Would you like to read more about Power BI? Try our article about incremental refresh.


- Facebook: https://www.facebook.com/profile.php?id=100066814899655
- X (Twitter): https://twitter.com/AcuityTraining
- LinkedIn: https://www.linkedin.com/company/acuity-training/