
News & Tips
AllAdobe IllustratorAdobe InDesignAdobe PhotoshopAutoCADCommunication & AssertivenessGuides & TipsLeadershipManagementMicrosoft 365Microsoft AccessMicrosoft ExcelMicrosoft OutlookMicrosoft Power AutomateMicrosoft Power BIMicrosoft PowerPointMicrosoft ProjectMicrosoft SharePointMicrosoft WordMinute TakingNewsPresentation SkillsProject ManagementResilienceSQLTime Management
The Q&A Visual In Power BI
This article is for Power BI beginners & intermediates who already understand what Power BI is and who are looking to learn how to use the Q&A visual. The Q&A visual in Power BI allows you to create visuals using…
Global Excel Summit 2025 Announced!
The Global Excel Summit for 2025 has finally been announced! It will take place from the 3rd to the 7th of February 2025, in London. You can register your interest early on through the Excel Summit website. We strongly recommend…
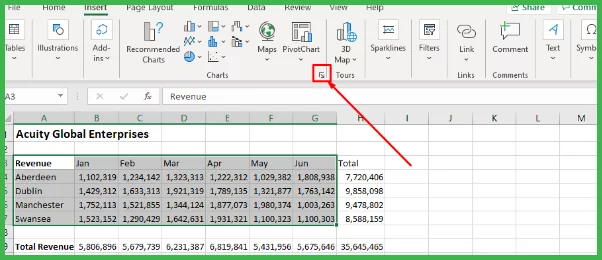
An Introduction to Charts in Excel
Charts are how you visualise data in Excel. These visualisations are fantatstic for presenting data for others, as well as summarising it for yourself. Delegates on our Excel courses always want to learn how to make great charts! What Is…

Excel For Web: A Comprehensive Guide
The significance of cloud systems in the workplace of the future is undeniable. And Excel for Web is an excellent example of a cloud-based tool that aligns with the needs of modern businesses. Spreadsheet management has long been a vital…
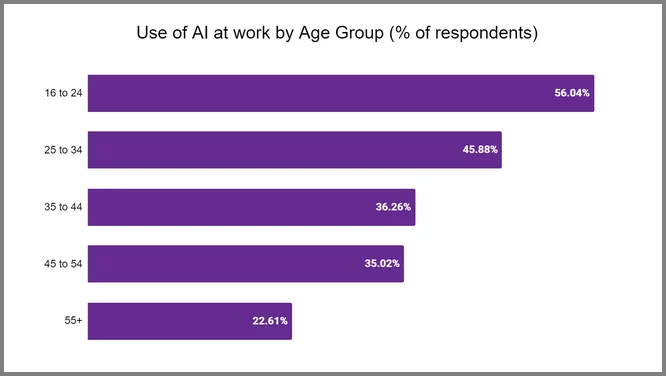
AI Statistics and Usage in the UK in 2024
AI is nothing new. But what is new is the rate at which adoption is increasing in 2023. The past few months have seen millions of people trying their hand at using platforms like ChatGPT. They use it to increase…
Implementing Row-Level Security In Power BI
In this article, we will look at static row-level security in Power BI. We look at what it is, how to implement it and areas to take care when using it. We find delegates on our Power BI Courses always…
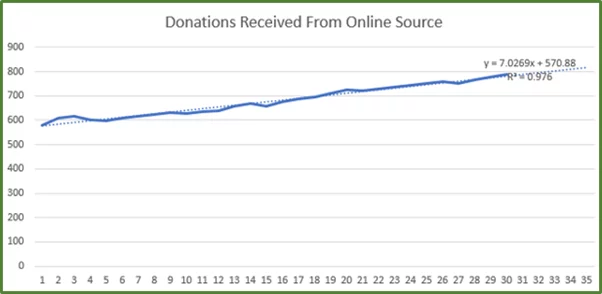
How to Use the Moving Average Forecast in Excel
This post explores how to set up a moving average forecast in Excel. To calculate a moving average, you take the mean of several values and then track how that average changes over time. It’s a technique that has a…
SORT And SORTBY Functions – Mastering Excels Array Tools
If you’ve ever tried doing so, you’d know how problematic data sorting in Excel could be. Doing it using formulas, you’d have to put together an insane combination of functions. However, the new dynamic array functions make it super-easy for…
Excel: Audit Formulas To Ensure They’re Correct
Excel has a variety of powerful tools in it’s toolbox to help you see what is going on in a spreadsheet with formulas. Formula Auditing can show you which cells are using what information in them and where the information…
Create A Flowchart In Excel Easily!
Flowcharts are very effective forms of visual communication. We are going to cover two different ways of creating flowcharts in Excel. What Is A Flowchart? A flowchart is a diagram that depicts the steps in a process, or workflow in…
Linking Data in MS Excel
What if all your data could be linked across from one sheet to another? You would stop needing multiple copies of the same data. You’d also minimize the risk of incorrect data due to forgetting to update the information across…
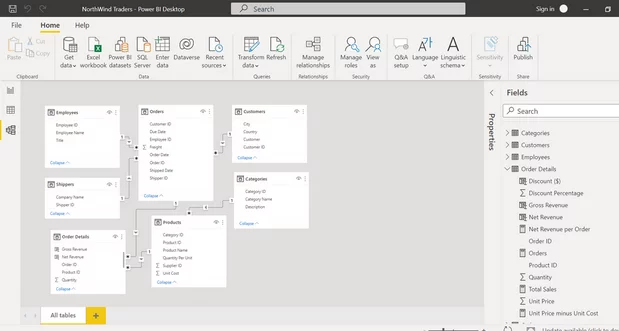
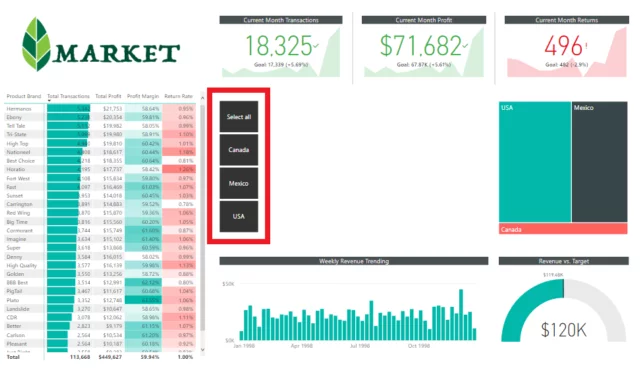
6 Best Practices for Efficient Data Modeling in Power BI
Why do over 62,000 businesses worldwide choose Power BI for analytics? The visuals are simply the best on the market. However, Power BI can be complex and difficult to use, especially for newcomers to the software. This is especially true…