
News & Tips
AllAdobe IllustratorAdobe InDesignAdobe PhotoshopAutoCADGuides & TipsManagementMicrosoft AccessMicrosoft ExcelMicrosoft OutlookMicrosoft Power AutomateMicrosoft Power BIMicrosoft PowerPointMicrosoft ProjectMicrosoft SharePointMicrosoft WordNewsResilienceSQLTime Management

5 Tips – Improve Your Listening Skills
There is a huge difference between hearing someone and listening to them. Listening isn’t always easy. But it is a key part of being a manager and a team member. This guide on learning listening skills goes hand in hand…

8 Ways To Build Rapport With Your Team
Rapport is people’s ability to relate. It allows people to be empathetic towards each other’s feelings and communicate well. Some people are gifted at it, but everyone can improve on it! So why is it so important? Rapport will make…

Open-Ended Questions To Build Relationships
‘The best investment is in the tools of one’s trade’ -Benjamin Franklin Open-ended questions are the tool you should invest in today. They are the key to building relationships at work. So how can you get started? 4 Tips For…
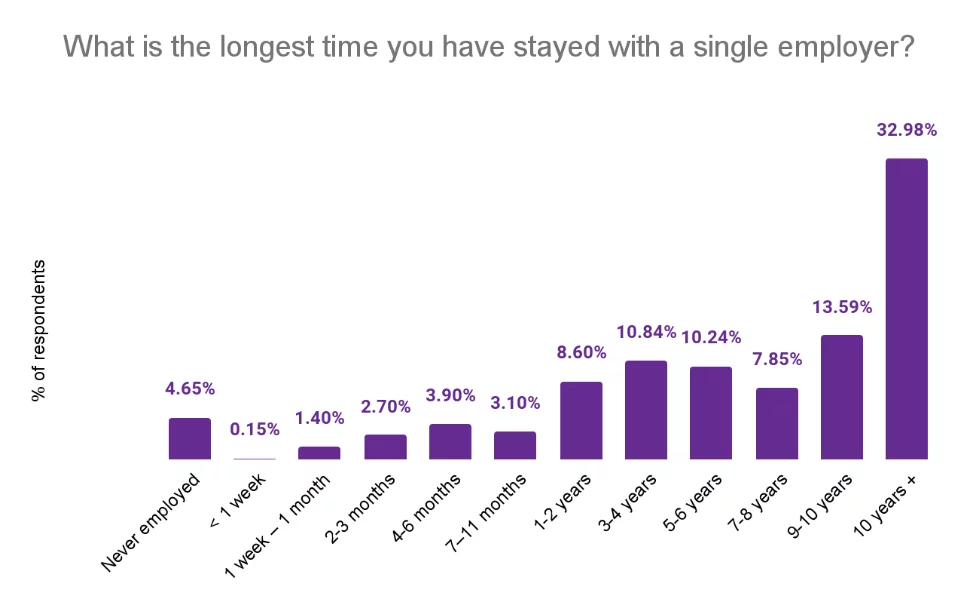
Employee Retention Statistics
Keeping staff can be absolutely vital to the success of your business. Getting the right people in place and keeping them is something that business owners have front of mind. But how hard is it? What causes people to leave…

Creating A Personal Development Plan
Sometimes you should just go with the flow. But having a plan will put your life on track. Everyone should have a personal development plan. What Are They? A personal development plan outlines the following: What is important to you?…
5 Tips To Become An Assertive Manager For Women
Assertiveness is a amazing trait to have as a manager. But becoming assertive will be a different path for each person! Women do tend to struggle with assertiveness more than men. Remember it is a learned skill. Practice and being…

Master Difficult Conversations At Work
At work, you’re going to have difficult conversations. But becoming good at them, will boost your career. As a manager, being able to have these conversations is a very sought after skill. From bad performance reviews, to having to let…
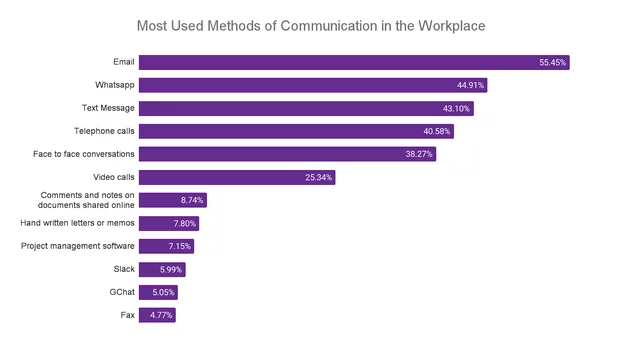
Communication Skills Statistics UK – Communication in the Workplace
Good communication makes us productive. Poor communication makes us frustrated. So how effective are we at communicating at work? We polled the public to find out how people communicate in the modern workplace. The Key Points – The most popular…

Assertiveness Statistics & Facts: NEW Research for 2024
Key Takeaways – 88% of people think that they are assertive at work. – Over half (55%) of people say they’ve missed work opportunities by not being assertive enough. – 57% of people say they’ve naturally become more assertive with…

Creating Heat Maps In Excel
When it comes to understanding large amounts of information, visuals are considered a better option than textual data. From making comparisons to using values for decision-making, visual images help professionals make sense of even the most complex situations. Microsoft Excel…
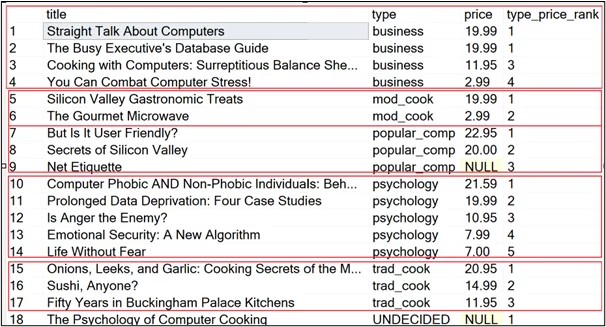
SQL Rank Functions
Among the myriad functions SQL offers, specific functions such as RANK and DENSE_RANK stand out for their utility in data analysis and reporting tasks. These functions empower users to make sense of data by enabling them to order and rank…
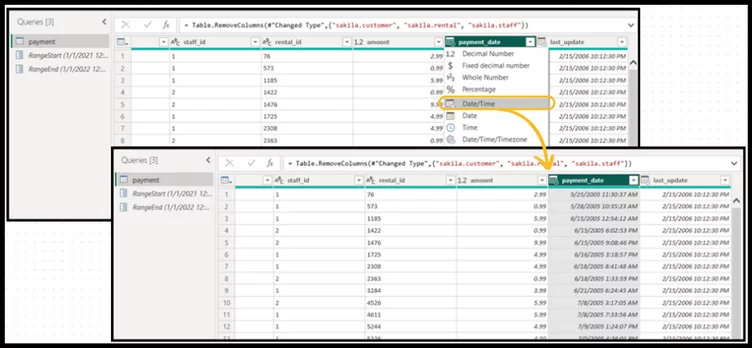
Incremental Refresh – Optimising Power BI
Optimising Power BI reports is crucial when it comes to speed and performance. Incremental refresh allows you to keep historical data (previously loaded data) within your data source and only refresh the data that is changing. Schedule refresh, on the…