
Excel’s GROWTH Function [2 Minute Guide!]
The GROWTH function in Excel is one of the most powerful and is very underused!
Excel GROWTH Function
The Excel GROWTH function is also known as the exponential GROWTH function.
It is a statistical function that returns predictive values based on the input data – amazing for data analysis.
For instance, for a given data set of X values, the GROWTH function would return you a Y value.
Short and crisp, the GROWTH Function is purported to help users form predictions based on a given dataset. This data set may represent historical patterns or competitive records.
Relationship:
The GROWTH function works on the relationship of
Y = b * m ^ x
Syntax:
The syntax of the GROWTH function reads as follows.
GROWTH (known_y’s, [known_x’s], [new_x’s], [const])
Arguments:
The syntax seems confusing? Let’s break it down to look into each component of it.
known_y’s: This is a required argument.
This includes the set of Y-values that are already known.
The known values are to be input in Excel which are then projected to find further Y-values.
[known x’s]: This is an optional argument
Take a sneak peek into the relationship above to see where Known-X lies. It serves as the exponent to a base value M.
As the X-values are only optional, if left vacant, Excel replaces the x-values with the array [1,2,3,4…] and so on depending upon the size of Y.
[new x’s]: This is an optional argument.
In contradiction to the Known-X (that is to be input into Excel), New-X is the value against which a corresponding Y-value is not known.
Excel applies the GROWTH function to find the corresponding Y-values against the New-X values.
If both the Known-X and New-X are omitted, Excel replaces them with the array [1,2,3,4…] and so on depending upon the size of Y.
[const]: This is an optional argument.
As the name suggests, Const stands for Constant. In the relationship Y = b * m ^ x, it is represented by B. It is a logical value that can either be True or False.
If True or omitted, the value of B is not forced as 1 and is calculated normally.
If False, the value of B is set to 1, and the value of M is manipulated to render the equation y = m ^ x
Return Value:
The return value for the GROWTH function is numeric.
This numeric value is predicted on the basis of the provided data series.
Where Should I Use The GROWTH Function?
There are several ways how you may use the GROWTH function to your advantage.
It helps users with financial and statistical analysis, it’s the data equivalent of an Average Forecast.
You can also use it to perform a quick regression or trend analysis by projecting values based on a given data set.
To quote a quick example, you may want to pull together a quick budget brief encountering the impact of the hike in petrol prices in the next year.
You can predict the upcoming rise in petrol prices based on the past trend of prices using the GROWTH formula in Excel!
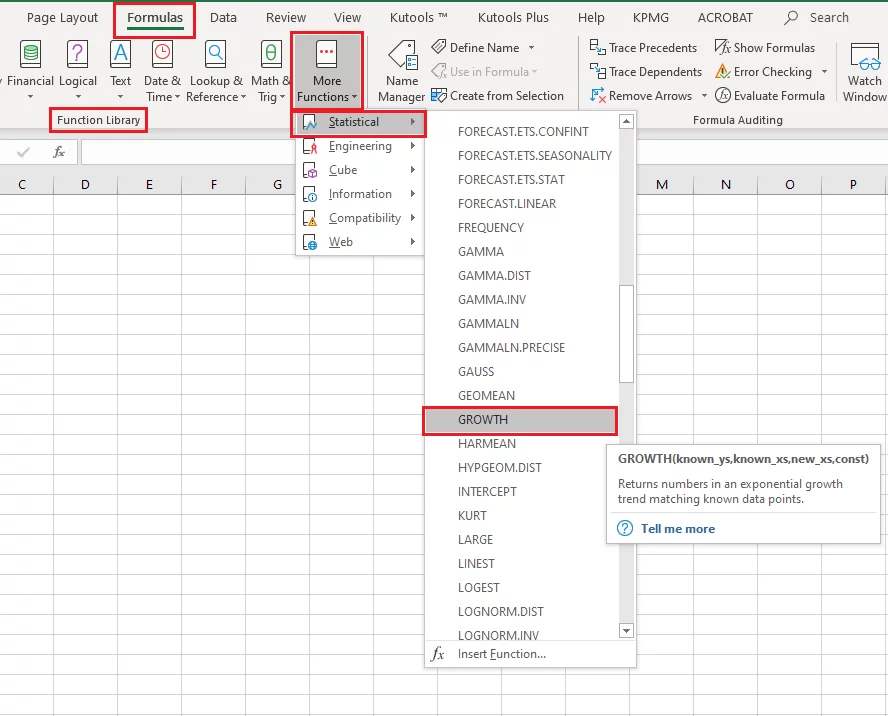
Pro-Tip: No need to memorize the complex-looking GROWTH formula stated above.
Access it from the functions library as follows.
Formulas > Function Library > More Functions > Statistical > GROWTH
GROWTH Function Use Cases
The GROWTH function is the go-to tool for many people from different professions – be it accountants, auditors, stockbrokers, actuaries, or businessmen.
A few practical use cases of this function are listed below.
- Businesses tend to issue prospectuses to raise finances for new projects. A prospectus consists of projected cashflows that a potential project is likely to generate. Using the Excel GROWTH function, future cash flows can be predicted with sheer ease and precision.
- Stockbrokers often build portfolios for their clients predicting the price trends for different stocks. Based on historical price movements, future rises and falls in share prices can be predicted using the GROWTH function.
- As an actuary, you may build estimates based on a given set of data. Or even otherwise, as a businessman, you may predict the GROWTH of your business’s revenue in the years to come.
This is why so many people do their accounting and bookkeeping in Excel – it works great with financial data.
How to use the GROWTH Function – Example
GROWTH function might seem like a complex one at first. But once you learn how the function works, it is more like child’s play.
Let’s put together a few examples to see how the GROWTH function may be employed in routine Excel operations.
Predicting A Single Value Using The GROWTH Function
The screenshot below represents the share price trends of a Company recorded during the last fiscal year.
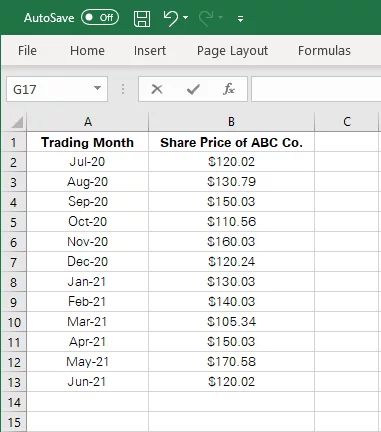
Based upon the past trends, is the share price likely to rise in the coming month or will it see a downturn? Hard to say? Let the GROWTH function do the job.

To predict the share price of ABC Co. in July 2021, here are the steps to be followed.
Step 1:
First of all, let’s decipher the given data in terms of the GROWTH function syntax.
In the above data, the Known-Y’s are the share prices for the months July 2020 to June 2021. These are the values already known and will be used as the basis for predicting the share price of the next month.
The corresponding months are Known-X’s. Although this is an optional argument that can be left out, it defines an array for Excel.
The month ‘July 2021’ is the New-X as we need the corresponding Y-value (i.e. the share price) against July 2021.
Step 2:
Once you know your arguments, the next step is all about putting them together in the GROWTH function to yield the results.
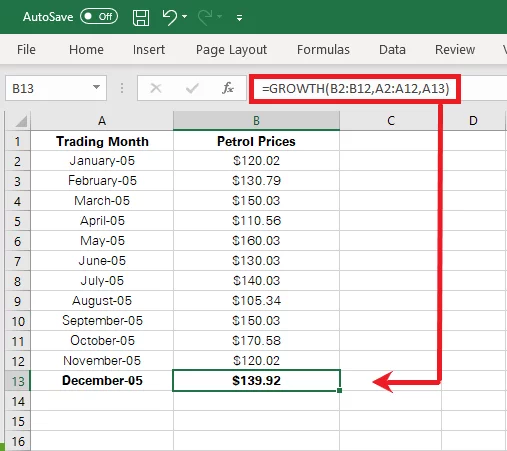
Here is the GROWTH function that must be populated to reach the share price for July 2021.
= GROWTH (B2:B13, A2:A13, A14)
The first argument ‘Known-Y’s’ is populated with the share price data listed under Column B.
The second argument ‘Known-X’s’ is populated with the month detail listed under Column A.
The third argument ‘New-X’ is set as A14. It contains the Known-X value (July 2021) for which we need the corresponding Known-Y value (the share price).
Hit enter to get results as follows.
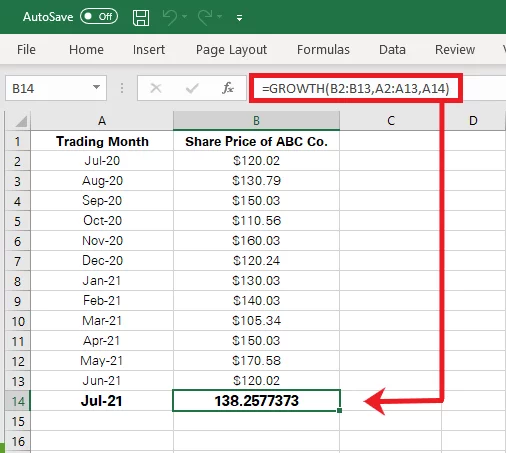
Excel predicts the share price for July 2021 as $138.25, which is slightly higher than the last month’s share price but in line with the overall sharp price trends during the year.
Predicting Multiple Values Using The GROWTH Function
The above example demonstrates how you may predict a value using the GROWTH function. However, at times, that’s not the case. You may want to project your data extending up to multiple values.
Does the GROWTH function allow predicting multiple values all at once?
It does, but with a smart move. Follow the example below to see how.
The data below represents the sales of XYZ Company for the preceding 10 years.
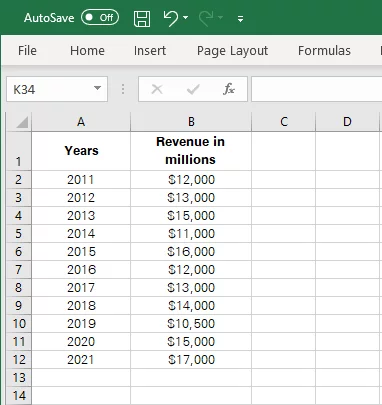
The company now wants to add more dimensions to its business.
But before that, it wants to predict the revenue for the coming years if it continues to operate on the same level.
The same can be done using the GROWTH function as follows.
Step 1:
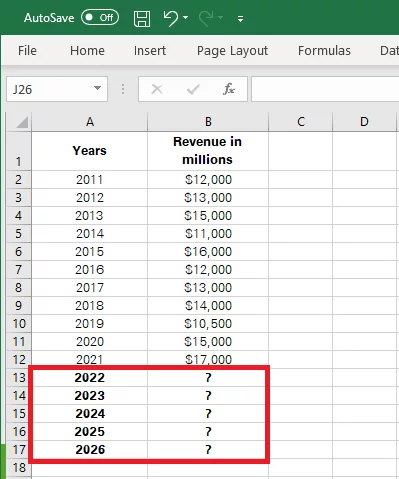
Identify the arguments. The Known-Ys in the above data are the revenue details as are populated under Column B. Similarly, Known-Xs are the years populated under Column A.
However, in this example, we have multiple New-Xs as we need to predict multiple values. These include all the years ranging from 2022 to 2026 for which the revenue is to be predicted.
Step 2:
Once you know the arguments, just put them together in the GROWTH formula as follows.
= GROWTH (B2:B12, A2:A12, A13:A17)
The first argument ‘Known-Y’s’ is populated with the revenue data listed under Column B.
The second argument ‘Known-X’s’ is populated with the year detail listed under Column A.
The third argument ‘New-X’ is set as A13:A17 that contains the Known-X values (the years 2022 to 2026) for which we need the corresponding Known-Y values (the estimated revenue).
Select all the cells from B13 to B17 and type the above formula in the formula bar as shown below.
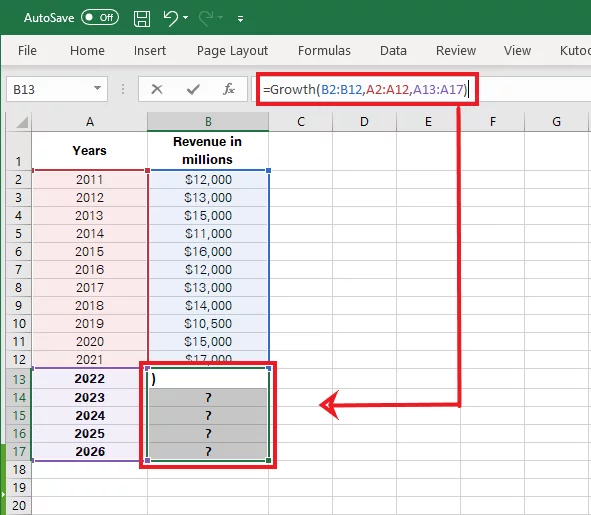
Once populated, now press Ctrl + Shift + Enter to execute an array.
As we want to compute the estimated revenue for all the years in a single click, it can only be done when Excel executes it as an array function.
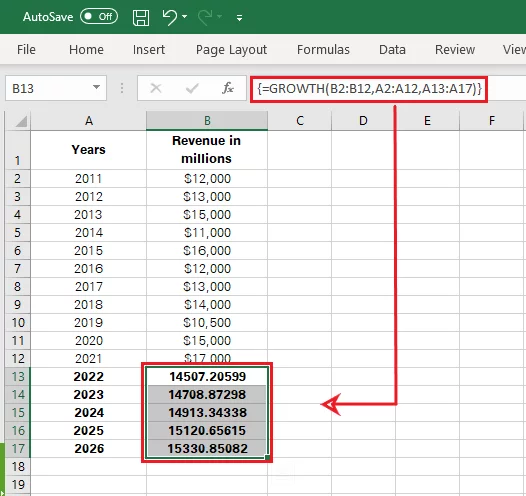
This encloses the above formula into flower brackets as are appearing in the formula bar above.
Pro Tip:
If all the cells are not selected while we execute an array function, Excel would return a value only against the selected cell.
Note:
If there are multiple values to be predicted and you don’t want Excel to execute an array function but to apply the GROWTH function to each value individually, simply change the above formula as follows.
= GROWTH (B2:B12, A2:A12, A13)
What has changed is the New-X argument. Instead of defining the range of cells, only define the New-X value against the selected cell.
For instance, A13 where the revenue for the year 2022 is to be found, A14 where the revenue for the year 2023 is to be found, and so on.
This is great for data modeling in Excel, which is a very valuable skill.
Troubleshooting with GROWTH Function
After you’ve come across the above examples, you’d know how simple and quick it is to apply the GROWTH function in Excel.
However, three common errors are often posed by Excel while using the GROWTH function.
Each of them is discussed below.
1. #REF! Error
Excel returns a #REF! error when the range of the defined Known-Ys is not of the same length as of the defined Known-Xs.
For instance, in the example below, Known-Ys extend up to Row 10, whereas, the Known-Xs range up to Row 5 only.
Put them together in a GROWTH function and hit enter to see Excel pose a #REF! error as below.
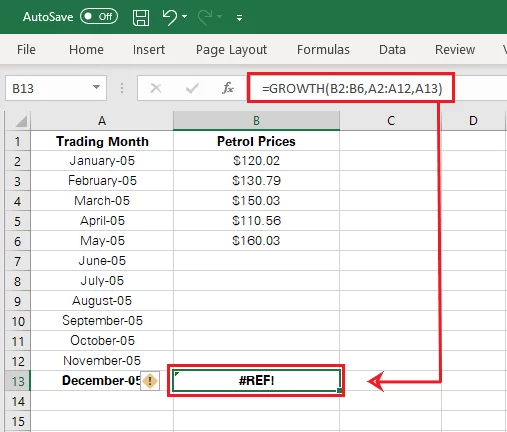
This is because the length of both the defined arguments is not in conformity.
Excel requires a strictly equal range for both the Known-Ys and Known-Xs to apply the GROWTH function.
You can also filter out unwanted data with Excel’s advanced filters to make your predictions more accurate.
2. #NUM! Error
After you enter the GROWTH formula for a given set of data and Excel gives back a #NUM! error, it’s time you go back and look out for any value in your dataset that is equal to or less than zero.
The mandatory argument of the GROWTH function, the Known-Ys must all be greater than 0. If any value in the Known-Ys array is zero or is less than zero, Excel would not be able to apply the GROWTH function.
Take a look below.
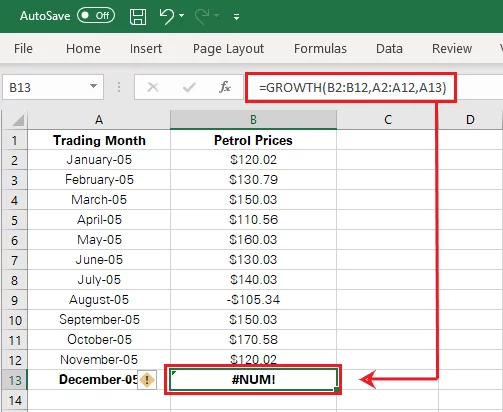
Only a single value listed against Row 9 turns out to be negative (i.e. less than zero) and Excel returns a #NUM! error.
3. #VALUE! Error
As the name suggests, a #VALUE! error comes up when the values fed are not in the right format. Under the GROWTH function, Excel can only process values in numeric or date format.
To get rid of the said error, select the data and change its format, as follows.
Home > Number > Number Format > Choose the desired format
For more error handling, we strongly recommend you master the amazing formula auditing tools Excel has.
Conclusion
The GROWTH function of Excel can be of great help for creating forecasts, reports, proformas, or even for simple domestic budgeting.
It comes along with a slightly complex syntax, but once you decipher it logically, it is only a matter of seconds to generate your data.


- Facebook: https://www.facebook.com/profile.php?id=100066814899655
- X (Twitter): https://twitter.com/AcuityTraining
- LinkedIn: https://www.linkedin.com/company/acuity-training/