Top 10 AI Excel Tools – Reviewed & Ranked
Contents
Over half of the modern world is using AI at work.
If you’ve not used it before Excel spreadsheets are a great place to start.
But which one should you use?
We decided to test the top 10 AI Excel Tools to see how good they really are.
Best Overall: Julius (18.5/20)
Julius AI performs extremely well across the board and is our pick for an AI Excel tool, especially for advanced users.
Best For New Excel Users: Akkio (18/20)
Akkio has amazing video tutorials and is the best tool for anyone new to Excel and AI Excel tools.
Best Value For Money: Ajelix (17/20)
Ajelix performs well across the board and is very strong for data visualisations. Great value at $6 p.m.
Best Without Data Visualisation: FormulasHQ (14/20 but 14/15 excluding visualisation)
FormulasHQ has amazing tools for data cleaning & analysis but doesn’t offer any data visualisation.
A good Excel AI tool offers more than just correct formulas.
It can explain what it is doing (similar to an instructor on an Excel course), create visualisations and is quick and simple to use.
To see how we tested these tools jump to the Appendix below, otherwise read on for a quick rundown of each tool we reviewed and what we found.
 |
|
| Free Trial: Yes | Cost: £34.25 p.m. |
| OVERALL SCORE: 18.5/20 | |
| Formulas: 5/5 | Explanation: 5/5 |
| Visualisation: 4.5/5 | Ease of Use: 4/5 |
| PROS: | CONS: |
| – Most accurate formula generator! | – Advanced features can be hard to use. |
| – Guides to help you get started. | – Limited integration with other tools. |
| – Works well on mobile. | – Nothing! We like it a lot. |
 |
|
| Free Trial: Yes | Cost: $49 p.m. |
| OVERALL SCORE: 18/20 | |
| Formulas: 5/5 | Explanation: 4/5 |
| Visualisation: 5/5 | Ease of Use: 4/5 |
| PROS: | CONS: |
| – Very intuitive to get started with. | – Works best with existing data. |
| – Teaches you how to use Excel. | – Can get confused at longer queries. |
| – Works with your own data sets. | – Takes effort to get the most out of it. |
 |
|
| Free Trial: Yes | Cost: $6 p.m. |
| OVERALL SCORE: 17/20 | |
| Formulas: 5/5 | Explanation: 4/5 |
| Visualisation: 5/5 | Ease of Use: 3/5 |
| PROS: | CONS: |
| – Amazing data visualisation suite. | – Explanations can be confusing. |
| – Gives complete reports on any data. | – Interface can be overwhelming. |
| – Affordable for such powerful tools. | – Could use more guides. |
 |
|
| Free Trial: Yes | Cost: $5.99 p.m. |
| OVERALL SCORE: 14/20 | |
| Formulas: 5/5 | Explanation: 5/5 |
| Visualisation: N/A | Ease of Use: 4/5 |
| PROS: | CONS: |
| – Supports lots of languages. | – Advanced features are tricky to use. |
| – Has a Python code generator. | – No data visualisation. |
| – Has a Regex expression generator. | – Nothing! We like it a lot. |
 |
|
| Free Trial: No | Cost: $8 p.m. |
| OVERALL SCORE: 13/20 | |
| Formulas: 5/5 | Explanation: 4/5 |
| Visualisation: N/A | Ease of Use: 4/5 |
| PROS: | CONS: |
| – Integrates straight into Excel. | – No free trial. |
| – Very affordable for such a powerful tool. | – Need to be running Excel. |
| – Gives a personalised AI that keeps learning. | – AI needs input to perform. |
 |
|
| Free Trial: No | Cost: $1.99 p.m. |
| OVERALL SCORE: 12.5/20 | |
| Formulas: 5/5 | Explanation: 4/5 |
| Visualisation: N/A | Ease of Use: 3.5/5 |
| PROS: | CONS: |
| – Very cheap for premium subscriptions. | – No free trial. |
| – Has a Google Apps Script generator. | – Steep learning curve. |
| – Excellent formula generator / explainer. | – No data visualisation. |
 |
|
| Free Trial: Yes | Cost: $9 p.m. |
| OVERALL SCORE: 12/20 | |
| Formulas: 4/5 | Explanation: 4/5 |
| Visualisation: N/A | Ease of Use: 4/5 |
| PROS: | CONS: |
| – Offers unique capabilities. | – Only three queries on the free trial. |
| – Data connectivity with Google Sheets! | – Need pro sub to not be limited. |
| – Everything is explained very well. | – Formulas can be overly complex. |
|
|
| Free Trial: Yes | Cost: $2.99 p.m. |
| OVERALL SCORE: 11.5/20 | |
| Formulas: 3.5/5 | Explanation: 4/5 |
| Visualisation: N/A | Ease of Use: 4/5 |
| PROS: | CONS: |
| – VBA and APP scripts generation. | – Not many other functionalities. |
| – No need to sign up for first 3 queries. | – VBA not accessible in free trial. |
| – The AI gives very clear steps. | – Formulas can be inconsistent. |
 |
|
| Free Trial: Yes | Cost: $5.99 p.m. |
| OVERALL SCORE: 11/20 | |
| Formulas: 4/5 | Explanation: 3/5 |
| Visualisation: N/A | Ease of Use: 4/5 |
| PROS: | CONS: |
| – Quick and effective for simple questions. | – Only generates or explains formulas. |
| – Information on Excel concepts. | – No info on how to apply the responses. |
| – Affordable and quick to sign up. | – Explanations can be inconsistent. |
|
|
| Free Trial: Yes | Cost: $6.99 p.m. |
| OVERALL SCORE: 10/20 | |
| Formulas: 3/5 | Explanation: 3/5 |
| Visualisation: N/A | Ease of Use: 4/5 |
| PROS: | CONS: |
| – Works great for simple queries. | – Answers can miss steps. |
| – Quick to get started with. | – Complex queries can be misunderstood. |
| – Also supports SQL. | – No data visualisation. |
Conclusion
We liked all of these tools. They all offer a remarkable step forward for Excel users.
We’re very conscious that these tools, and artificial intelligence more generally, are evolving very quickly.
We plan to review this market again in future and can’t wait to see how they have evolved and improved.
Particularly now that Copilot is commercially released, we would be happy to rate it if people are interested!
It’s an amazing AI assistant, and we are even running Copilot training courses as we are so keen on it.
Think we’ve missed a tool? Great, the more, the merrier!
Please email us at admin@acuitytraining.co.uk and let us know. We’ll include it in the next test.
Appendix: Testing Methodology
A good tool offers far more than correct formulas.
We also tested them to see:
- How easy they are to use and set up,
- How good the explanations they provide are, and
- How good they are at generating graphs and data visualisations.
To test the formula-creating abilities of these tools we created increasingly complicated scenarios to test the tools.
Testing the other aspects of the Excel AI tools involved setting them all up and using the tools across a number of tasks. While we looked for harder metrics to rank them with we couldn’t find any that we felt were fair.
Formula Tests
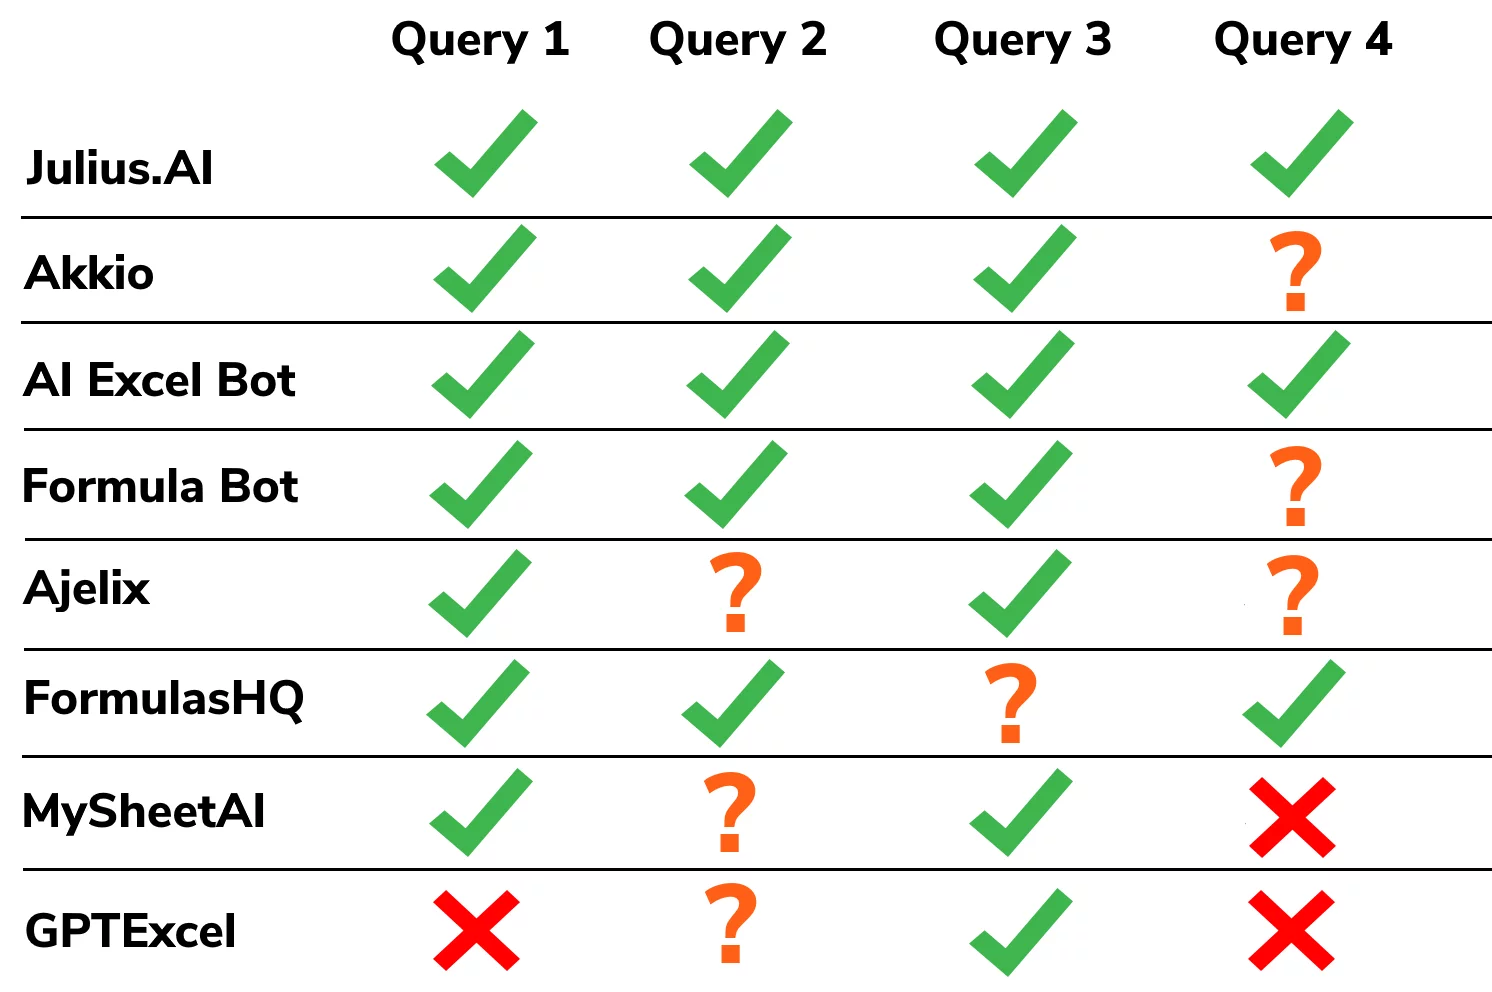
To test their formula-generating performance, we generated 4 complex queries to see how each tool handled them.
In the grid below a tick is a correct formula, a cross is a wrong formula and a ? is where the AI misunderstood the request.
Query 1:
Let’s set up a table with the following columns:
Order ID: Unique identifier for each order
Product: Name of the product
Quantity: Number of units sold
Unit Price: Price per unit
Total Sales: Quantity * Unit Price
Desired Outcome:
Add a new column to apply a 10% discount to the total sales amount if:
The total sales for an order are greater than $100, and
The price per unit after the discount is applied is more than $100 per unit.
Query 2:
We have a table with the following columns:
Order ID: Unique identifier
Order Status: Pending, Shipped, Delivered
Priority: High, Medium, Low
Desired Outcome:
We want a single formula that applies conditional formatting based on the following logic:
If the Order Status is “Pending” AND the Priority is “High”, highlight the cell in red.
If the Order Status is “Shipped”, highlight the cell in yellow, regardless of the Priority.
Leave all other cells with no specific formatting.
Query 3:
Formula to Calculate Bonus:
Columns: Employee ID, Name, Sales Amount, Sales Target, Bonus Percentage.
Desired Outcome:
Calculate the bonus amount if the sales amount exceeds the sales target.
The bonus is calculated as (Sales Amount – Sales Target) * Bonus Percentage.
Query 4:
Let’s set up a table with the following columns:
Product ID: Unique identifier for each product
Product Name: Name of the product
Current Stock: Current number of units in stock
Minimum Required Stock: Minimum number of units that should be in stock
Reorder Quantity: The number of units to reorder
Restock Status: Indicates whether the product needs to be restocked
Desired Outcome:
Highlight the product name in orange if the current stock is below the minimum required stock.
Calculate the reorder quantity as the difference between the minimum required stock and the current stock if the current stock is below the minimum required stock.
Display “Restock Needed” in the Restock Status column if the product needs to be restocked.

 10. GPTExcel


