
3 Ways To Use Excel For Accounting And Bookkeeping
Excel is still widely used for accounting and bookkeeping purposes.
Many businesses and entrepreneurs continue to use Excel to record, store, analyze and manage their records.
This is because Excel is easy to use, cost-efficient, and one of the most common Microsoft tools to date.
Particularly, Pivot Tables, Forecast Sheets, and What-if Analysis are a few features commonly used by businesses and entrepreneurs for bookkeeping and accounting.
All of this and more is taught on our Excel courses in central London, as learning to use Excel is key for anyone looking to get into finance.
Accounting & Bookkeeping
Microsoft Excel can be used to record and maintain financial data. This data may include purchases, sales, expenses, inventory, supplier and customer information, personnel records, and much more.
Bookkeepers and accountants would often prefer Excel for small-scaled accounting tasks. And why not?
You can use it to perform calculations, store volumes of data, create charts, and employ many numerical functions.
Putting together graphs in Excel is the easiest. Learn more about them here.
With a few introductory training sessions, Excel Accounting may prove relatively simpler than running complex accounting software.
What makes the job easier are the readily available Excel bookkeeping templates, macros, formulas, charts and graphics.
This is part of why Excel is so suitable!
Excel offers a wide variety of readymade templates to aid accounting and bookkeeping. These templates are already fed with built-in macros, formulas, and options to source data. However, they are generic templates and must be adapted (customized) to the needs of the users.
Access the readymade Excel bookkeeping templates here.
Files > Search for the template that you want to use
You can select from the Free excel bookkeeping templates or you can search one as per your need from the tab to search online templates.
Pivot Tables
Pivot Tables stand out as one of the most powerful features of Excel. Given its flexibility, you can quickly build visually appealing reports in Excel. It allows you to transport data from different sources and arrange it to different avenues.
Pivot Tables do not restrict your data to a particular outlook. It only takes a few quick clicks to change the horizons of data presentation in a Pivot Table.
It makes filtering super easier. Have multiple regions to your data set but want to look into two only? Simple, uncheck the others from Pivot Table Fields.
Also, what makes Pivot Table the best for accounting and bookkeeping is its ‘Update’ feature. If you have all your records organized in Excel that goes through several phases of edits, approvals, and consolidation, your final reports might be outdated.
When presented through Pivot Table, all your reports only need a single ‘Refresh’ to incorporate all the updates of the source data.
Use Case:
For example, a company may have its sales’ data spread across multiple spreadsheets. These spreadsheets are reviewed and approved at multiple levels, and many changes are not incorporated in the final sale report.
The Company may collate all its sales from multiple source files in a single report through Pivot Table. Every time any of the source files bears any change, the final report can be updated by refreshing the Pivot Table.
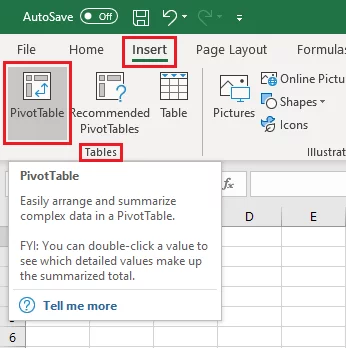
You may insert a Pivot Table to your Excel sheet as follows.
Insert > Tables > Pivot Table
Forecast Sheets
Forecast sheets are one of the most brilliant features of Excel introduced with the 2016 update of Excel. And guess what, it remains a mystery to many users to date.
If you have a large set of historical data that features seasonality, you may use forecast sheets to build budgets and forecasts based on the same. With Excel forecast sheets, you are free to choose the timeline of your choice.
That being said, you can project your data up to 1 year, 2 years, 5 years, or any other interval. You can also take control of the fluctuation range surrounding the projected values by adjusting the Confidence interval.
Forecast sheets allow users to set the seasonal pattern for their forecast either manually or automatically by Excel. This modern feature of Excel can help you with accounting and bookkeeping in so many ways.
Use Case:
For example, you may want to determine the Minimum Inventory Level and Re-order level for the coming financial year. A quick way could be creating a forecast sheet in Excel that predicts the inventory consumption for the upcoming year.
To do so, Excel would identify a pattern of consumption based on the historical inventory consumption of your business. You may put together an Excel sheet for various other similar uses and budgeting purposes. It is easy, quick, and intelligently designed.
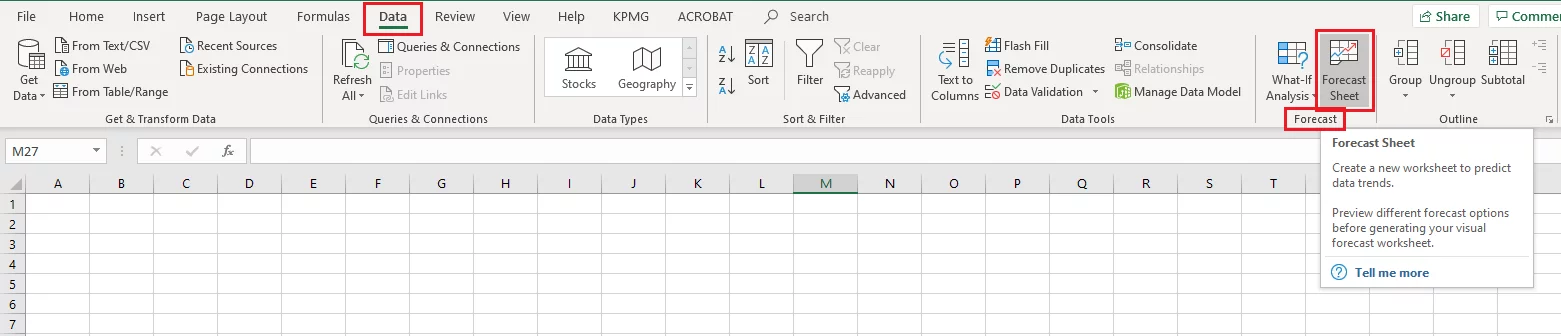
Create a forecast sheet in Excel in no time through the following path:
Data > Forecast > Forecast Sheets
What-If Analysis
As the name suggests, the What-if Analysis helps you use different sets of data in defined formulas to analyze how the result varies with the data.
1. Scenarios:
A scenario represents a set of values that you can save in the Scenario Manager in Excel and substitute them for specified cell values. You can save multiple sets of values in Excel as different scenarios and replace them to analyze the results with different scenarios.
Use Case:
For example, you may define a set of values as the best case and another set of values as the worst case. Selling only 5,000 units in a month maybe the worst-case scenario for a company. Whereas, selling up to 50,000 units in a month maybe the best case for a company.
To compute results in both cases, that is the best and worst scenario, you can define value sets containing sales of 5,000 and 50,000 units.
This feature of the What-if Analysis is a great help for accounting and bookkeeping in Excel as it helps you foresee the results you might attain if your business runs at different levels. This further helps you determine the ability of your business to continue as a going concern.
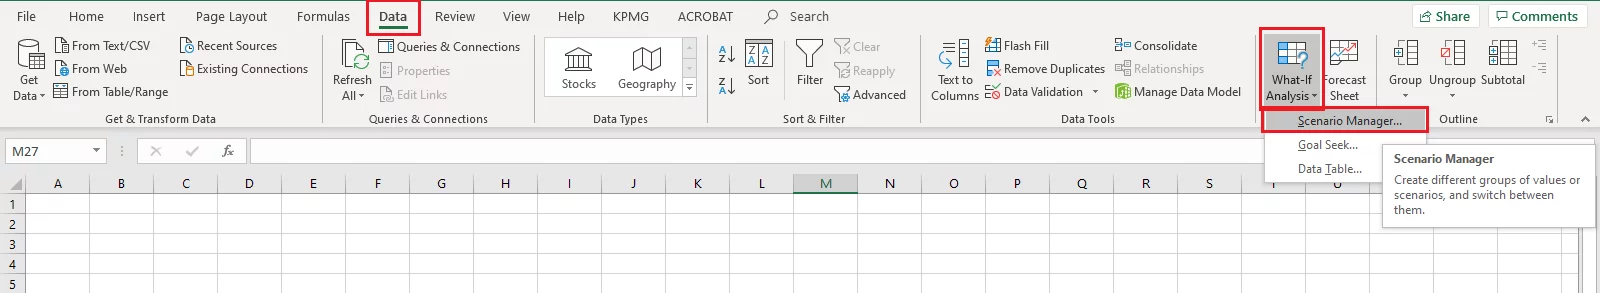
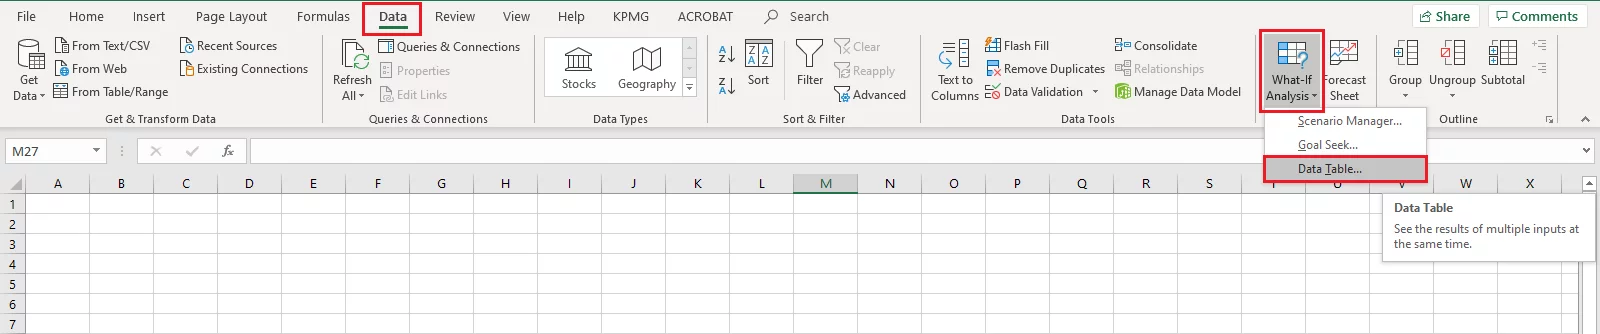
Reach out for Scenarios in Excel as follows.
Data > Forecast > What-if Analysis > Scenario Manager
2. Goal Seek:
Goal Seek helps you determine the input values for a pre-determined output value. If you want to achieve certain results but are not sure about the input that goes into achieving the same – you need the Goal Seek feature.
Use Case:
For example, a company wants to take up a new project and is not sure about the price to be quoted. It knows the cost that goes into the project including fixed overheads, variable overheads, direct costs, raw material costs, and everything else.
The Company wants to keep a profit margin of 20%. With all these inputs, the Company can use Goal Seek to determine the price to be quoted.
Goal seek is a helpful feature when it comes to accounting and bookkeeping in Excel. It helps users with putting together budgets and forecasts. It also helps you set goals for your business or any other purpose.
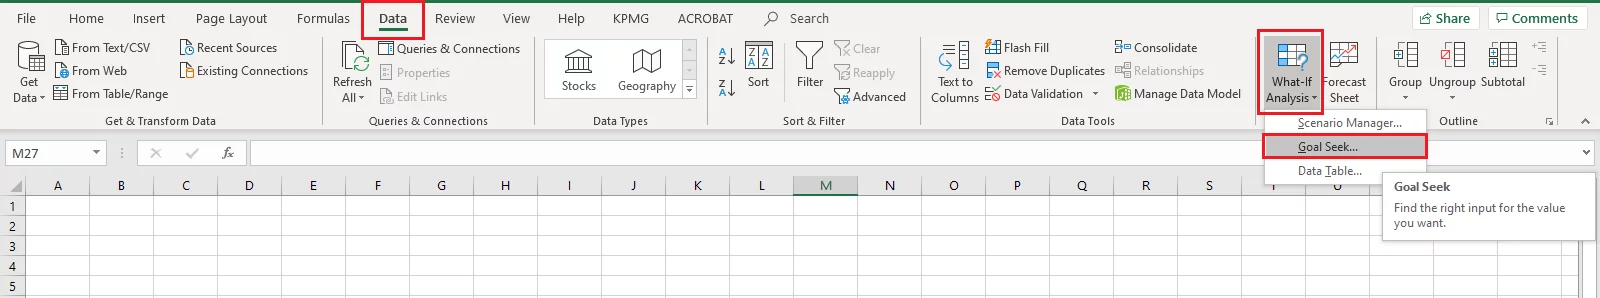
However, Goal seeks works the best with only a single variable determination. Reach out for the Goal Seek feature in Excel as follows.
Data > Forecast > What-if Analysis > Goal Seek
3. Data Tables:
Data Tables help you with formulas that use one or two variables. It presents all the outcomes in one place to help the users analyze the results of all possibilities at a glance. As it focuses on a single variable, the results are presentable and easily readable.
Use Case:
For example, suppose you want to take a loan but are not sure about the interest rate that suits you. Simply input the amount, term of loan and range of interest rates being offered. A data table would help you analyze the interest payments you’d have to make against each rate.
Data tables are great for accounting purposes as they help users to collate together the options available to them. With all the potential outcomes collated, users can readily analyze them all and reach the optimal decision.
Reach out for the Data Tables feature in Excel as follows.
Data > Forecast > What-if Analysis > Data Tables
Accounting in Excel – Complex Example
Excel can help your accounting and bookkeeping needs through many of its excellent features. For now, let’s stipulate examples to see how you can employ the aforementioned features to do accounting in Excel.
1. Pivot Table
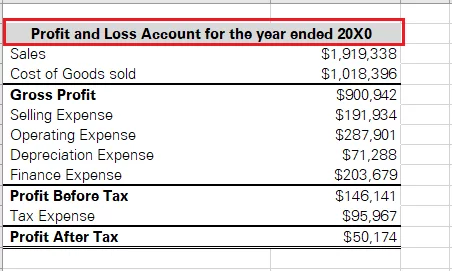
A Pivot table helps you extract data from external files and sources. For instance, as an accountant, you might want to prepare a ‘Profit and Loss Account / Income Statement’ from the sales, purchases, and other records.
Here is how you can use Pivot Table to help you with that.
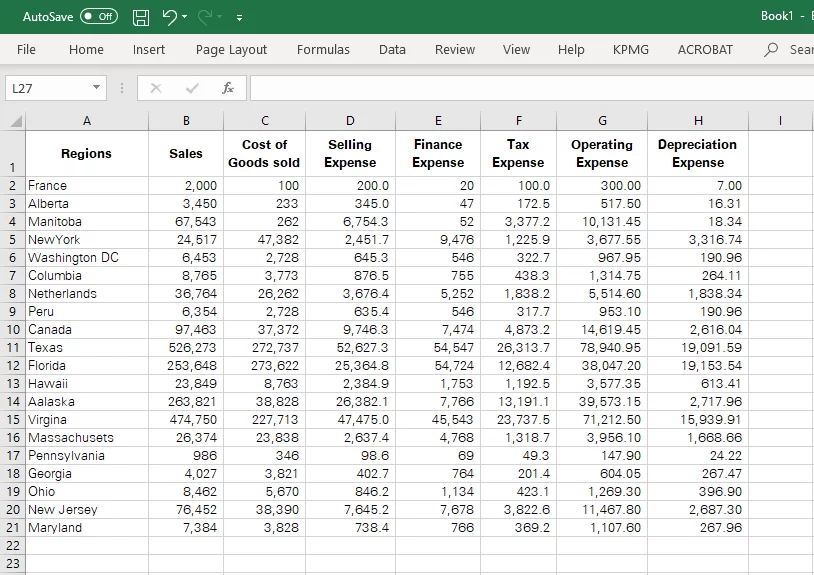
The screenshot above manifests the records of a Company that are to be transformed into a P&L Account.
Step 1:
Select the data to be transported through Pivot Table and insert a pivot table through the following route.
Insert > Tables > PivotTable
This opens up a dialogue box as follows:
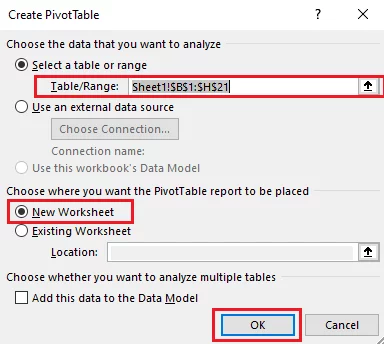
Excel would automatically identify the selected cells as the table/range.
Choose the destination place as ‘New Worksheet’ and hit okay.
Step 2:
The window for PivotTable Fields opens up as follows.
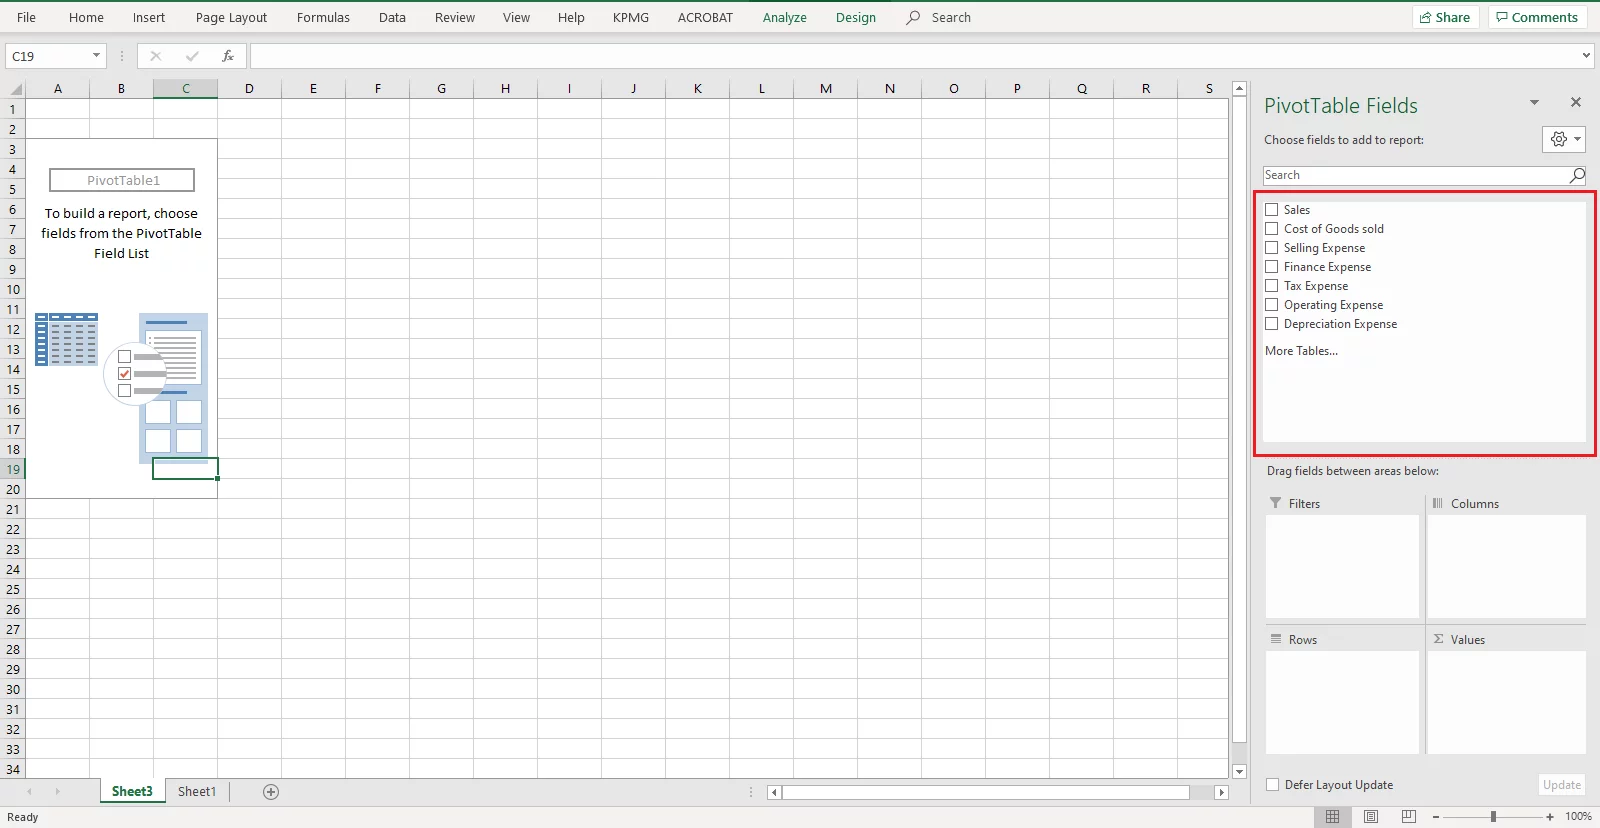
From the fields appearing in the upper block of the box at the right, drag and drop the fields to the relevant boxes below.
To prepare a P&L account, we only need the Sales and other expenses collated. So start picking them up and place them in the ‘Sum of Values’ box below as follows.
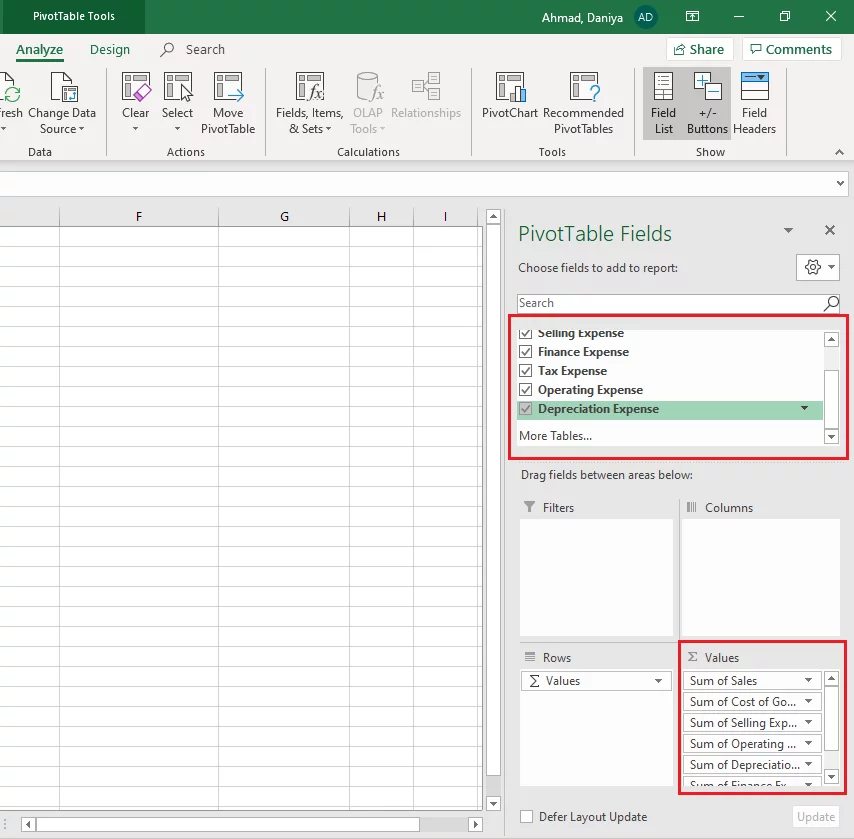
The ‘Sum of Values’ box takes the sum of each selected column in the final Pivot Table.
The order in which the fields are dragged and dropped in the said box is followed in the Pivot Table.
You can easily reposition the items by dragging them up and down in the ‘Sum of Values’ box.
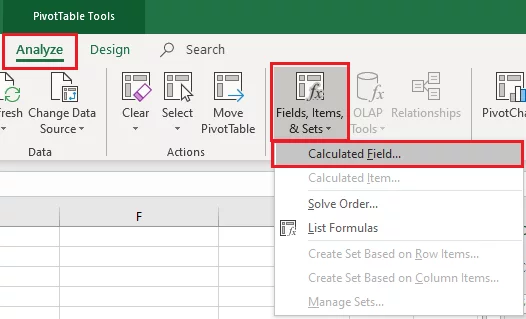
Step 3:
Up till here, Excel has collated all the fields together. However, you might want to add additional rows to your P&L account for sub-totals like ‘Gross Profit’, ‘Profit Before Tax’ etc.
You can add sub-totals to your PivotTable through the following route:
Analyze > Calculations > Fields, Items & Sets > Calculated Field
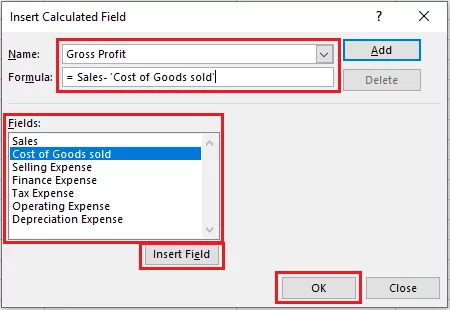
From the dialogue box that then opens, select the fields that you want to add up or calculate the differential of. For instance, to add a row for ‘Gross Profit’ i.e. Sales less Cost of Goods Sold, feed the formula as shown below.
Here is what your Pivot Table looks like with the sub-totals added.
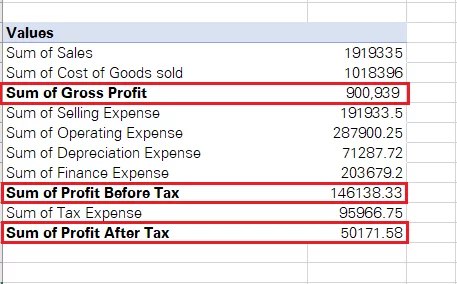
Try adding some simple borders as pivot tables don’t come with any by default!
Step 4:
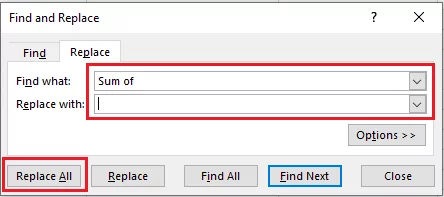
Now, when you have the basic structure of your Pivot Table ready, you may work out what it looks like. For example, you may want to change the row titles from ‘Sum of Sales’ to ‘Sales’ by using the Find and Replace Function as follows.
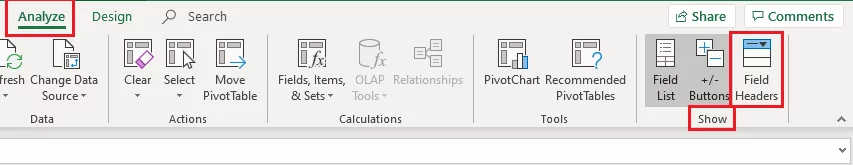
Similarly, you may not want the header ‘Values’ to the Pivot Table. You may remove it as follows.
Select the Pivot Table > Analyze > Show > Uncheck Field Headers
Add the Header ‘P&L’ account to the Pivot table and format the numbers to currency format to finalize how your P&L account looks.
And that’s it. You’ve made a P&L account using Pivot Table in Excel. Accounting and Bookkeeping in Excel using Pivot Tables is as simple as that.
Pro Tip: With countless updates, approvals and consolidations, there are high chances of your Pivot Table being outdated.
There may be changes to the source data that you want to be incorporated in the Pivot Table. To do so, simply select the Pivot Table > Analyze > Data > Refresh > Refresh All.
Excel would automatically update the figures and automatically recalculate the Pivot Table.
2. What-if Analysis
Take a sneak peek into the corporate world to see how massively it relies on the What-if Analysis. It offers three brilliant features to help users with their several needs. These include Scenarios, Goal Seek and Data Table.
Let’s take a look into an example as to you may use the What-if Analysis for accounting and book-keeping purposes.
Step 1:
The data below shows the share price trend of a Company during a year.
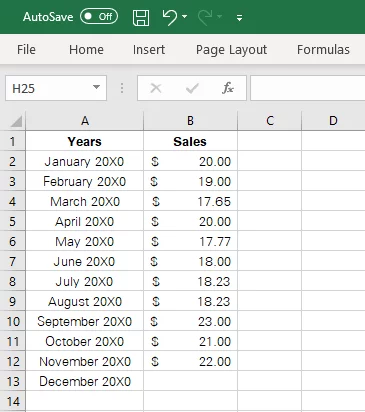
The year-end is only a month away, and the Company is under pressure to show an average price of $20 per share. What share price should the Company yield in the last month of this year to meet the targeted average.
The first step is to calculate the average reached by the Company until now. Simply pull together the Average function of Excel to know.
=AVERAGE (B2:B13)
The results displayed by Excel are as follows:
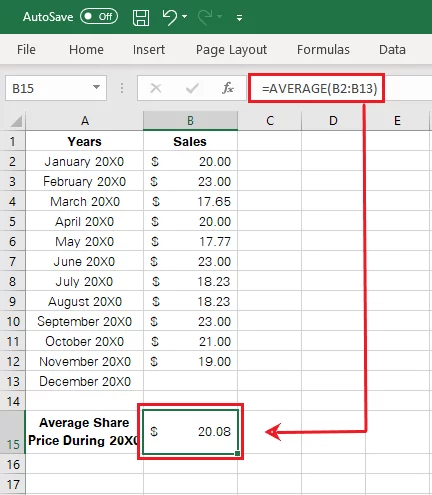
Note: Include the month of December 20X0 in the calculation of average share price so when it is input the average will adjust automatically.
Step 2:
To know the targeted share price for December 20X0, select cell B13 and employ the Goal Seek feature of What-if Analysis as follows.
Data > Forecast > Forecast Sheet > Goal Seek
This would open up a dialogue box as follows.
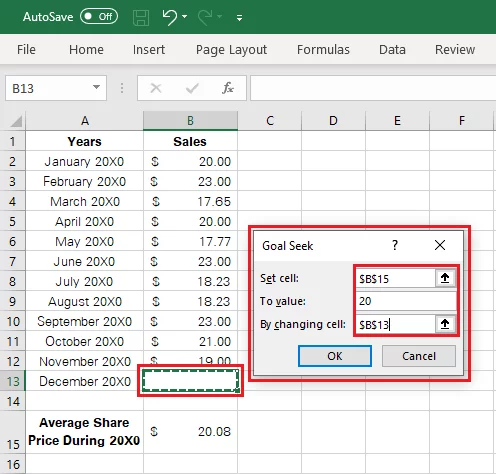
The Goal Seek options speak for themselves. We want to find the targeted share price for December to reach a per annum average price of $20.
So, technically, we want Excel to set the average share price to $20 by adjusting the share price of December 20X0.
Saying it in the terms of formula, we want Excel to set the value of cell B15 to $20 by adjusting the value of cell B13. Feed that into the Goal Seek dialogue box and press ‘Ok’
The results are as follows:
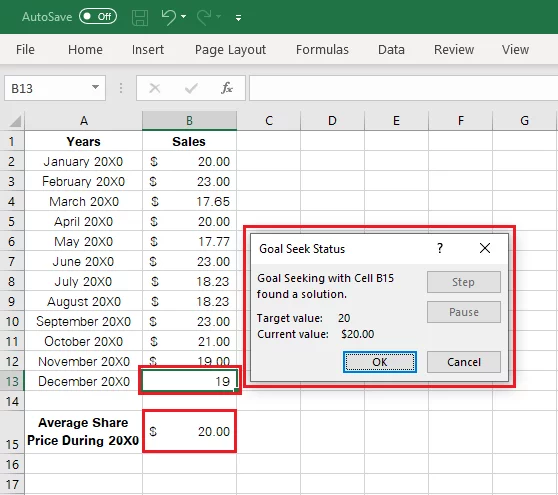
The targeted share price for December 20X0 turns out to be $19. The Company must retain its share price at $19 to yield the average price of $20 by the year-end.
Goal Seek and other functions of What-if Analysis can widely help the accounting and bookkeeping needs of many users. For example, you may use it to determine the cost limits, sales targets, profit margins, etc.
Similarly, you may use Data Tables and Scenarios to explore a set of possible outcomes and optimize your business decision-making.
3. Forecast Sheets
Forecast sheets make one of the most important features of Excel for accounting and bookkeeping purposes. You can use them to visually represent the performance of your business over a historical period.
In addition to that, based on the historical data input, it also helps you forecast the upcoming results. Here is how you can prepare a forecast sheet in Excel.
Step 1:
The screenshot below represents the data to be populated in the forecast sheet.
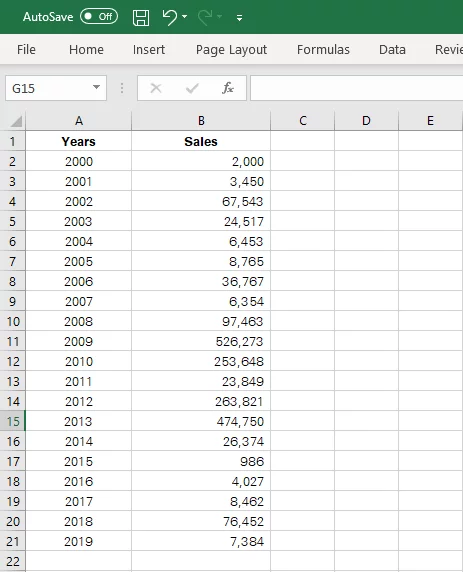
To insert a forecast sheet, select the data to be plotted > Data > Forecast Sheet.
Step 2:
This would open up a dialogue box as shown below.
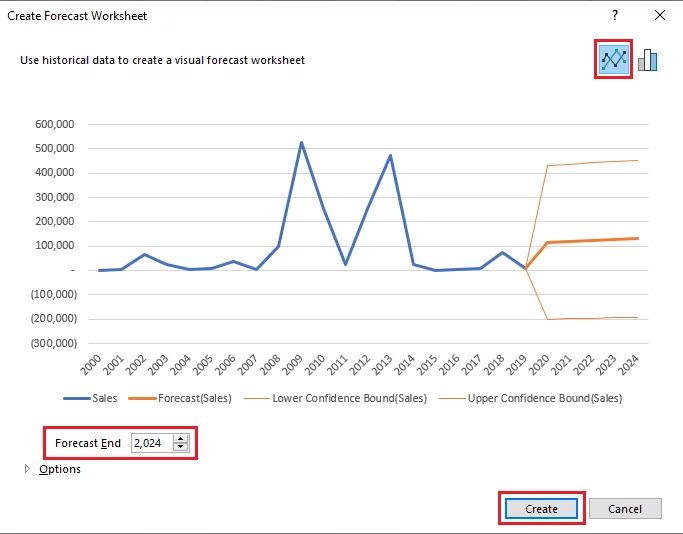
From the button located at the bottom left of the said window, you may set the timeline up to where you want the forecast sheet to be plotted.
Our data set contains historical data ranging from 2000 to 2019. And the forecast end is set to 2024. You can range it up as you need.
Hit ‘Create’ when you are all ready.
Step 3:
Here is how the Excel forecast sheet looks.
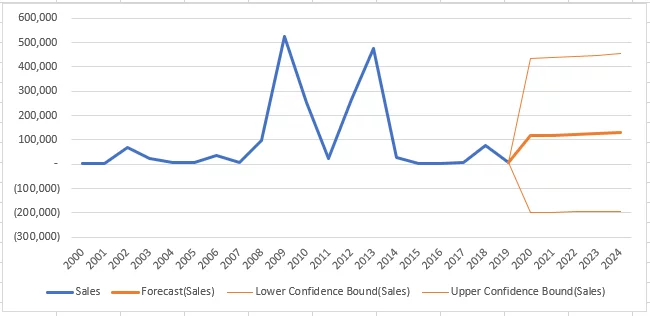
Looking around your dataset, you would find three new columns added.
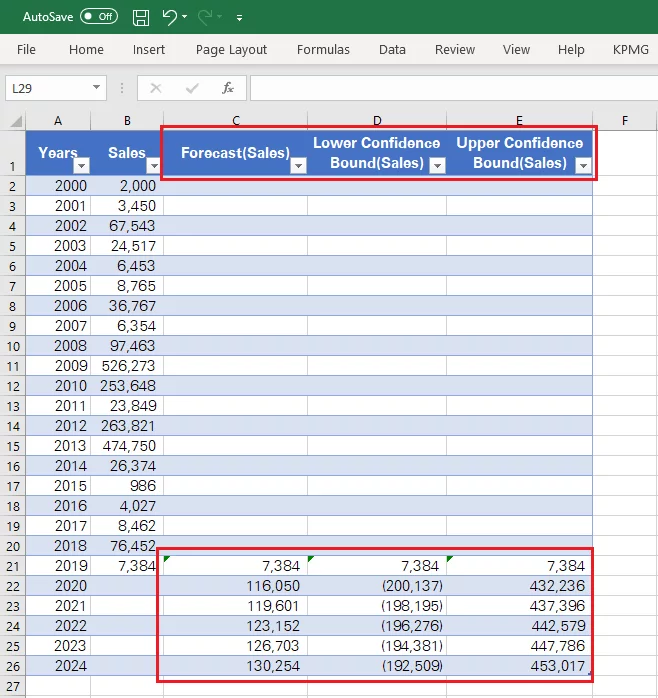
These include the column for forecasted values, lower confidence bound, and upper confidence bound.
This mainly predicts the degree of fluctuation against the predicted values. You may adjust it by increasing or decreasing the Confidence Interval.
Conclusion:
Excel can be a valuable tool for businesses that are still in their initial growth phases. It helps you record volumes of data, tabulate and compare financial data, and create graphs to visually represent the same.
Particularly, the aforementioned functions are sure to help you with most of your accounting, bookkeeping, and decision-making jobs.
While every bookkeeping tool has its share of disadvantages, Excel is sure to save you a good chunk of time, cost, and effort


- Facebook: https://www.facebook.com/profile.php?id=100066814899655
- X (Twitter): https://twitter.com/AcuityTraining
- LinkedIn: https://www.linkedin.com/company/acuity-training/