
Microsoft Power BI
Our Power BI articles below clearly and simply how to use specific aspects of Microsoft Power BI that we also cover in our Power BI training courses.
AllAdobe InDesignAdobe PhotoshopManagementMicrosoft ExcelMicrosoft Power AutomateMicrosoft Power BIMicrosoft PowerPointMicrosoft ProjectMicrosoft SharePointMicrosoft WordPresentation SkillsSQLTime Management
Build Incredible Reports With Power BI
If you need to compile data from different sources into a report, the Power BI Report Builder is your ideal tool. It allows you to display calculated fields, tables, filters and parameters. The report can be as simple or as…

How Dynamic Row Level Security Can Help You [Complete Guide]
Using dynamic role-level security, you can restrict users’ access to reports and dashboards based on their login credentials. Row-level security is often abbreviated as RLS! This is one of Power BI’s more advanced features that is covered in our Power…
Exporting From Power BI To Excel [Fastest + Simplest Method]
Power BI has the best visualisations out there. But sometimes you need to work alongside someone who’d rather use Excel! Being flexible in the softwares you use is a great way to become an important and valued team member.…
How To Recreate Sum If In Power BI!
In this article, you will see how to use DAX (Data Analysis Expressions) in Power BI to implement the Power BI Sum If function. The Sum If function is used to sum values in a data column based on a…
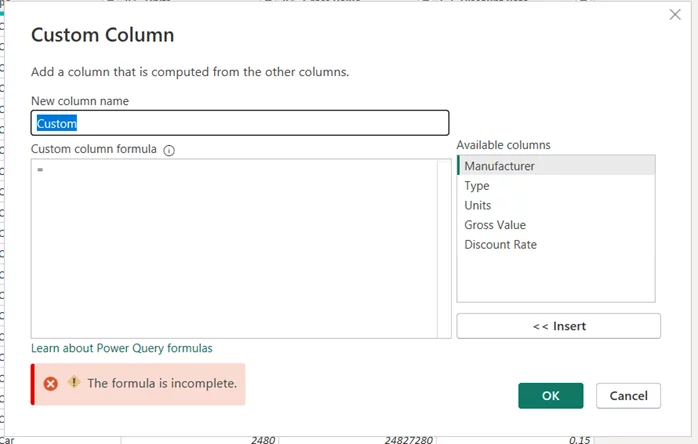
Enhance Your Data Analysis With Custom Columns [Power BI Guide]
Custom Columns are the key to enhancing your data analysis. Find out their practical applications, and delve into the step-by-step process of creating them here. They offer users the ability to create calculated columns within their datasets, creating enhanced data…
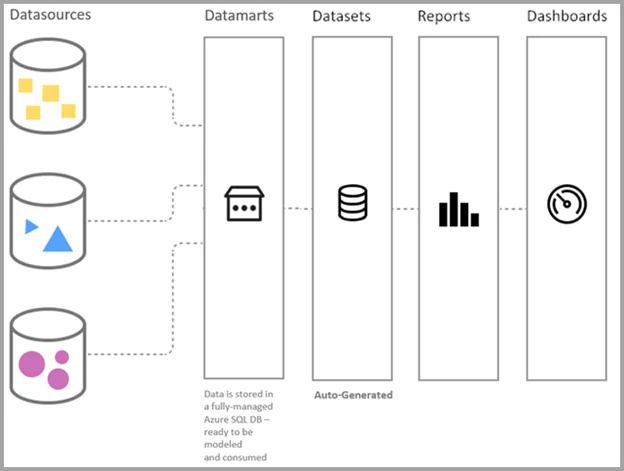
What Are Power BI Datamarts And Why Should You Use Them?
Organisations worldwide continuously explore new ways to transform their data into actionable insights and make informed decisions. This explains the extensive use of advanced business intelligence tools such as Microsoft Power BI for interpreting and acting upon data effectively. Within…

The Format Function [DAX’s Functions!]
The DAX format function is a Power BI text function that allows you to convert a value to text in a format that you have specified. It is a basic DAX function that most people learn on a DAX beginners…

The Today Function [DAX’s Functions]
The Today function in DAX is a very useful when working on date-related data. It is a volatile function that updates or refreshes every time there is a workbook change to return the current date. Description of the Today Function…
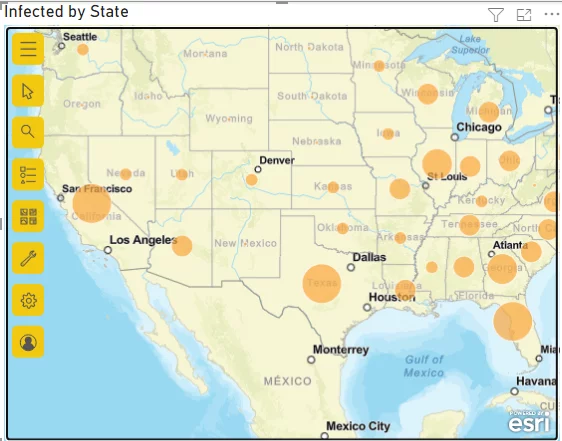
[Ultimate Guide ]Learn Every Type Of Map In Power BI!
Power BI Map Visuals are used to plot data distributions with respect to that data’s geographical location. Map visuals are typically used to visualise data by country, state or city but can be used on any type of map. In…
Comparing Power BI Dashboards vs Reports
In this article, we will look at the main differences between Power BI Reports and Dashboards. The article explains how to create Power BI Reports and Dashboards, their unique features, and when to use each of them. Power BI is…
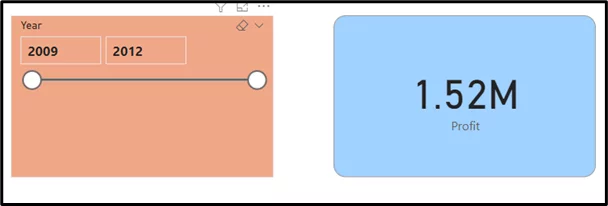
[Intro] Power BI’s Date Slicers
This article looks at using a Power BI Date slicer on different types of Power BI visualisation. We will also look at creating a date slicer with hierarchies. We cover date slicers during our Power BI courses if you would…
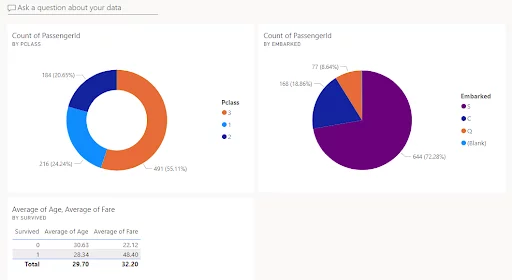
Master The Smart Narrative Visual [Advanced Guide]
The Smart Narrative visualisation summarizes the information in your Power BI dashboard into text very quickly. It uses natural language processing to automatically generate text based on the visuals in your report. Visuals are part of both our introduction and…