
Exporting From Power BI To Excel [Fastest + Simplest Method]
Power BI has the best visualisations out there.
But sometimes you need to work alongside someone who’d rather use Excel!
Being flexible in the softwares you use is a great way to become an important and valued team member.
If you would like to learn more on Power BI through formal training, have a look at our Power BI courses.
Exporting Data From Power BI Desktop
Power BI Desktop allows you to create visualisations using various data inputs, such as the QA visual – which we recommend for people looking to start making visualisations.
For this example, we are getting data from a report with a simple graph.
First navigate to your report and find the graph you want to bring over to Excel.
Export it by clicking the three dots on the top right or bottom right of your chart as shown below:
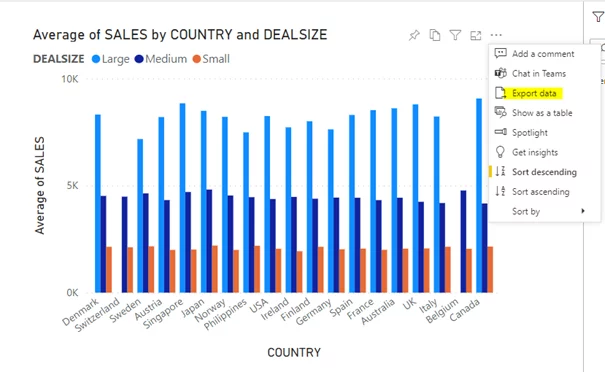
You will see the following download options.
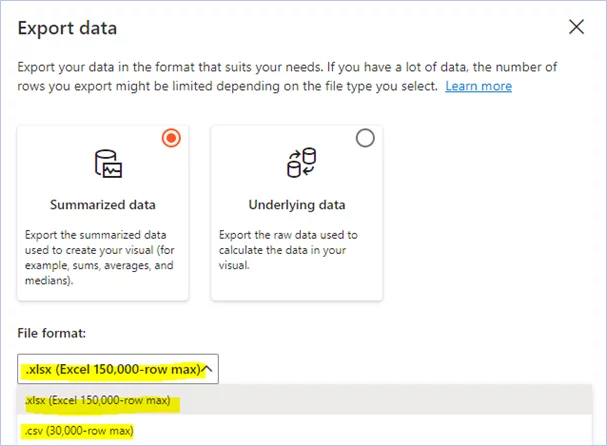
Here you can export the Summarized Data or the Underlying data.
– The summarized data will return the simple information needed to make up the graph.
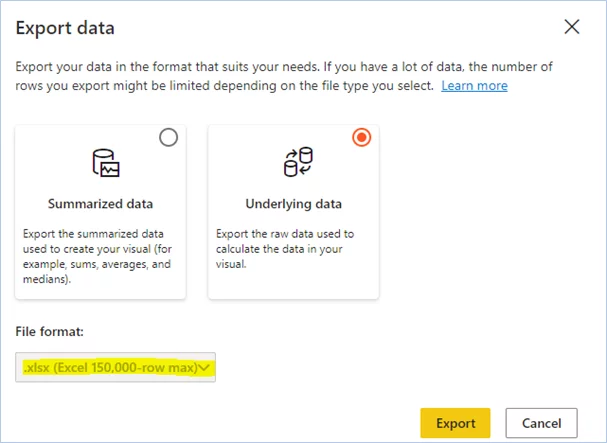
– The underlying data will return all the underlying data information used to plot your chart.
You will also see it has .xlsx as well as .csv formats.
If in doubt, just stick to .xslx unless someone has asked you to use .csv specifically!
Let’s export the “Underlying data” for our chart in the .xlsx format.
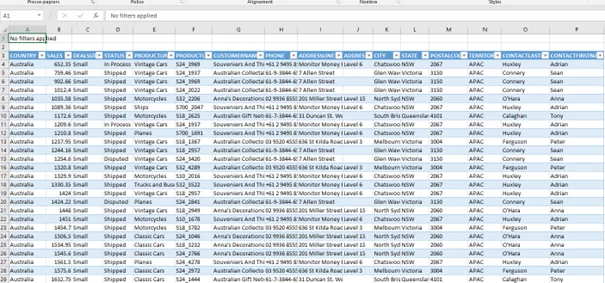
Now, when you open the downloaded file, instead of displaying average sales per country and dealsize:
The file contains detailed information about every sale including the country name, product price, status, postal code etc.
Conclusion
As you’d expect, Microsoft makes it very easy to move data between Power BI and Excel.
It’s even possible to export from Power BI to PowerPoint! Understanding how to work across platforms like this is important when learning how to use Power BI.
If you would like to know more about Power BI, we recommend this article on Power BI datamarts.


- Facebook: https://www.facebook.com/profile.php?id=100066814899655
- X (Twitter): https://twitter.com/AcuityTraining
- LinkedIn: https://www.linkedin.com/company/acuity-training/