
Build Incredible Reports With Power BI
If you need to compile data from different sources into a report, the Power BI Report Builder is your ideal tool.
It allows you to display calculated fields, tables, filters and parameters.
The report can be as simple or as complex as you need it to be.
If you’re looking into learning about the Power BI Report Builder with the support of a trainer to whom you can ask all your questions, check out our Power BI training courses.
What Is The Power BI Report Builder?
The Power BI Report Builder app is used to create and design paginated reports from Power BI Datasets and other various data sources.
Paginated reports are an ideal solution when there is a need to showcase data on multiple pages in printed form.
Unlike creating reports in Power BI Desktop, the Report Builder will provide a snapshot of your current data.
There is no ability to change the data modelling, apply calculations or interactive visuals using this tool.
Which Power BI reporting tool should I use?
Power BI Report Builder
You want to build standard non-interactive paginated reports, which will be based on the current status of a data source.
Power BI Desktop
You want to build interactive report solutions, for rich data modelling and analysis.
Launching/Familiarising Yourself With The Environment
|
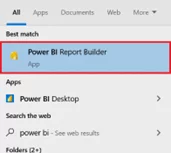
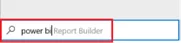
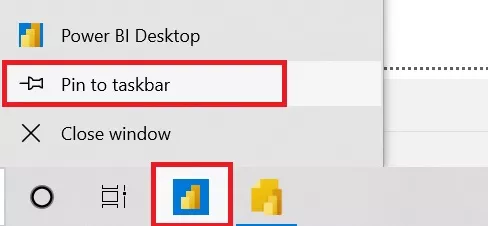
Once installed, you can locate the app through your Windows search bar; by entering Power BI, the Report Builder will be located. For ease of access, if the Report Builder is going to be a regularly used app, add a shortcut to your Task Bar.
|
  |
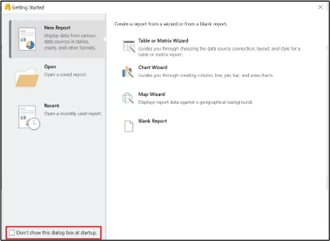
| The Getting Started dialogue will appear each time you load the Report Builder.
This is a quick and easy way to access recent and saved reports. You can also launch one of the New Report wizards from here. This option can be switched off if you want to bypass this and go straight to a blank report. Select the Don’t Show This Dialog Box At Startup checkbox to disable this feature. |
|
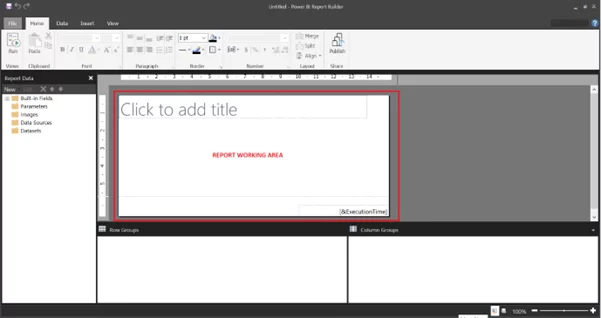
As shown above, the screen layout is very easy to use – the ribbon at the top of the screen will gain you access to all options required for building your report.
The Report Data, Row Groups and Column Group task panes will be displayed automatically and the Report Working area is ready for you to start inserting report objects to build your final report.
Before you can successfully create a meaningful report, you will need to add a Data Source and build some Datasets.
Data Source and Datasets
Each report created will require some Data to populate the report – a Data Source is a connection to external data.
The external data can be either an existing Power BI Dataset Connection, Microsoft Azure SQL Database, Microsoft SQL Server, or ODBC to name a few.
You can connect as many Data Sources as required; however, these will need to be externally available to you.
Once your Data Source is created, you will need to add at least one Dataset. Datasets can be combinations of Data Source Fields, Calculated Fields, Filters and Parameters.
Build as many categories of Datasets as required. These will be used to populate the objects in your report.
Adding A Power BI Data Source
With your new report displayed, use the following procedures to connect to a Data Source:
Login to your Power BI Service.
Within the Report Data task pane, right-click on the Data Source option and select Add Power BI Dataset Connection.

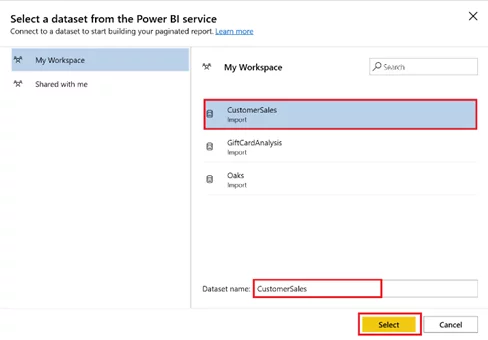
Select either My Workspace or Shared With Me to display a list of available Datasets. Select the one required, and if necessary change the Dataset Name value – this is how it will be named within the Report – and click Select.
Adding A Data Source
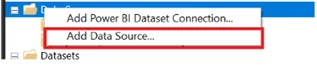
Within the Report Data task pane, right-click on the Data Source option and select Add Data Source.
Enter the name you want to use for your Data Source.
Select the connection type you wish to use, you will need to select the build button to apply all the connection criteria.
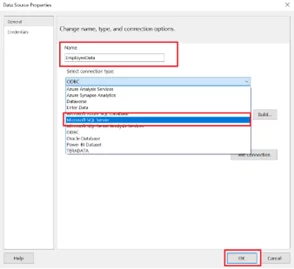
Click OK to create the connection.
Adding A Dataset
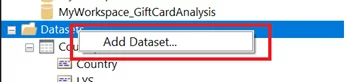
Within the Report Data task pane, right-click on the Datasets option and select Add Dataset.
In the following example, only a Query selection is being made for the Dataset.
However, if required you can additionally add Calculated Fields, Filters and Parameters combined together in the Dataset.
Complete the Dataset Name and select the Data Source name. As the example shows, this is using a Query to select fields from the Data Source. Use the Query Builder button to build the Dataset required.
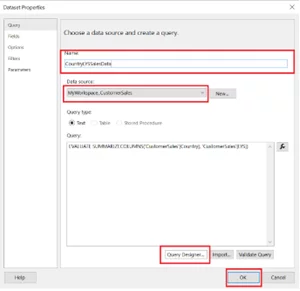
Once complete, click OK to create the Dataset.
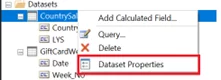
If you need to amend the Dataset at any point, you are able to right-click on the Dataset name and select Dataset Properties from the shortcut menu to display the above dialogue.
Generating A Simple Report
Paginated reports can be as simple as a list of items or more complex where a group of related documents are generated, i.e. invoices, sales orders etc. In each case, with a Dataset(s) in place, you insert the relevant objects onto the Report working area. The objects can be added from the Insert ribbon tab and in some cases right-click on the working area.
A blank report will consist of a Text Box – this primarily will be used for your report title. Click once on the object to activate edit mode and enter the text required.
 |
 |
To change the appearance of any object inserted, right-click on the object and select the appropriate Properties option from the shortcut menu displayed, or select the object and use the Home ribbon tab to apply formats.
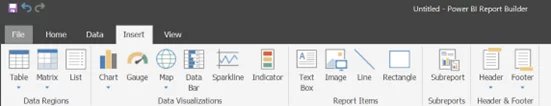
Use your Dataset to generate Data Regions and Data Visualizations. For example, to add a Table, use the following procedures:
Select the Table button on the Insert ribbon tab – using the wizard option is useful if you are new to working with these features.

Select the Dataset to be used and click the Next button.

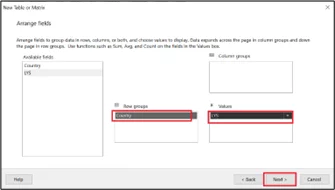
Now select the fields to populate the Table – drag and drop the required fields into the Group sections (of which you must have at least one Row or Column) and the Values area. Click Next to continue.
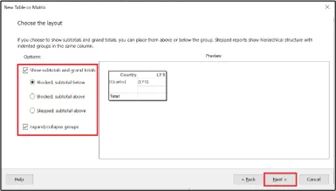
Select your choices for the Table Layout. As you select/de-select choices, an example of how the Table will appear will be displayed. Click Next to continue.
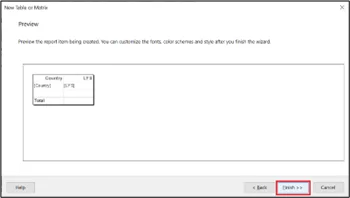
A preview of the Table will be displayed. Once you are happy with the results, click Finish.
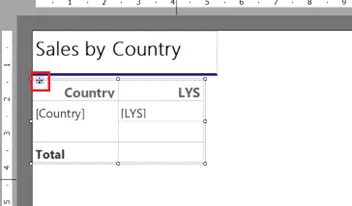
The Table will be positioned as far to the top left corner of the Report page as possible. If this is not the desired position, hover over the sector cross icon and drag it to the new position.
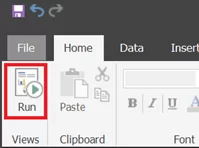
To see a preview of the Report, on the Home ribbon tab, select the Run button.
Click on the Design button on the Run tab to return to design mode to continue to add further information to your
report. Switching between Design and Run modes will allow you to visualise the build-up of data on your report.
Use the Save button to save your Report.
At this stage, you can either Print to PDF/Hard copy or Publish to your Power BI Service.
If publishing, select the Publish button on the home tab and complete the necessary options as shown.
The report will be available to users who access your Power BI Service environment.
Power BI Report Designer Top Tips
- Report data conveyed generally leads to action! Identify the questions being asked; your report content should help answer these.
- Use standard naming conventions for your Datasets across all reports. Indicating the data source name it’s based on can be very useful, especially for others who may need to amend your report.
- The following keyboard shortcuts are very useful when manipulating reports:
Arrow Keys – move the selected report object(s)
Ctrl-Arrow Keys – nudge the selected report object(s)
Ctrl-Shift-Arrow Keys – increase or decrease the width/height of the selected report object(s) - Right-clicking on a report object will not only select it but display the context menu of choices.
Conclusion
Now you have a full understanding of what are Power BI Reports and how you can use them to show data from several sources.
Just bear in mind that this is a tool to present static data, and you won’t be able to update it from within the report.
If you would like to know more about Power BI, have a look at our article about Power BI relationships.


- Facebook: https://www.facebook.com/profile.php?id=100066814899655
- X (Twitter): https://twitter.com/AcuityTraining
- LinkedIn: https://www.linkedin.com/company/acuity-training/