
Enhance Your Data Analysis With Custom Columns [Power BI Guide]
Custom Columns are the key to enhancing your data analysis.
Find out their practical applications, and delve into the step-by-step process of creating them here.
They offer users the ability to create calculated columns within their datasets, creating enhanced data analysis and reporting.
Custom column are also covered in our Power BI Training!
How To Create Custom Columns with Power Query
To create a Custom Column, we need to follow a few steps:
Step 1
Open the Transform Data – Power Query Window.
Step 2
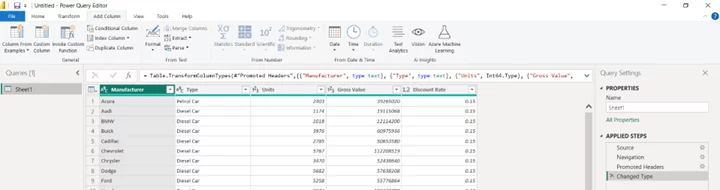
In the Power Query Editor, click Add Column Menu, Click Custom Column.
Step 3
You should now see the Custom Column Menu. The next section wil now detail this window.
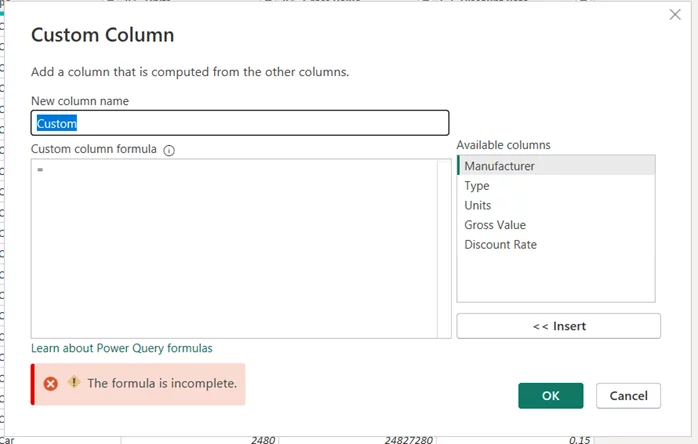
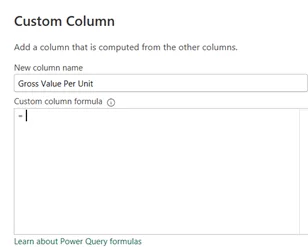
New Column Name
This will be the name for your newly created Custom Column.
Custom Column Formula
This is where you will enter your formula/expression similar to that of Excel calculations, we will revisit this in a minute.
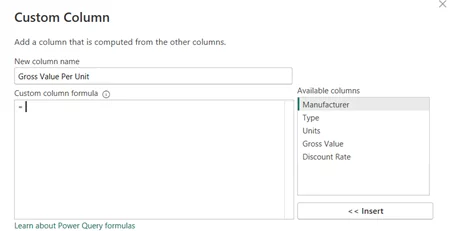
Available Columns
This area displays your current dataset. You can select which column (field) you want to edit and then click insert.
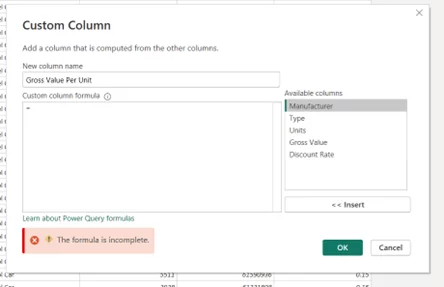
Completed Custom Column
This lower area flags whether your formula is correct, when correct you can then click OK to complete your Custom Column. You can also learn about more complex formulas by clicking ‘Learn about Power Query formulas’ these won’t be covered in this article.
You can also use the valuable data from these custom columns when sharing reports in Power BI!
Custom Column Formulas
So, we now know how to enter the Custom Column screen and its general navigation. Now it is time to create our first Custom Column.
To create a custom column you need a dataset, the dataset example we will use is based on car sales in the US. The dataset includes Manufacturer, Type (Diesel/Petrol), Units, Gross Value, and the Discount Rate.
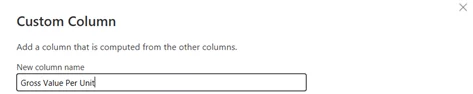
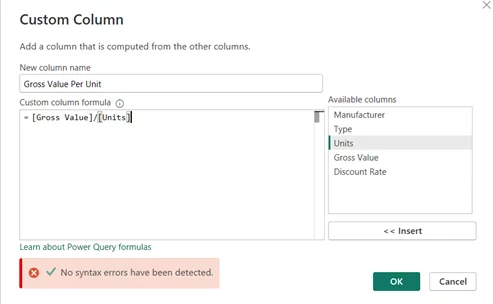
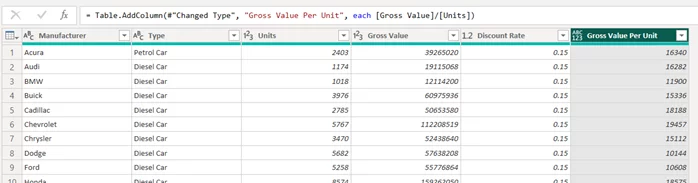
Gross Value Per Unit (= [Gross Value]/[Units])
The business wants to know what the value of each car. To find this out we need to divide the Gross Value by Units.
To create this custom column, create the name ‘Gross Value Per Unit’ then double click ‘Gross Value,’ followed by ‘/’ which is the function for divide, finally double click ‘Units.’
Once complete the prompt will show ‘No syntax errors have been detected. Go ahead and click ‘OK’
The ‘Gross Value Per Unit’ Custom Column added to our dataset. The business can now see that the price for an individual Audi is €16,282
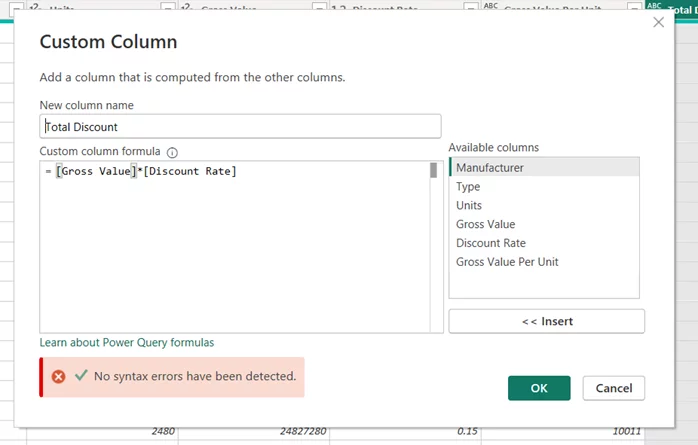
Total Discount (= [Gross Value] *[Discount Rate])
The business has questioned why we have not calculated the final value of the cars, to report this we must first calculate how discounts has given to each customer.
To find this out we need to add a new Custom Column, to calculate the ‘Total Discount’ we need to multiply the ‘Gross Value’ by the ‘Discount Rate’
To create this custom column, create the name ‘Total Discount’ then double click ‘Gross Value,’ followed by ‘*’ which is the function for multiply, finally double click ‘Units.’
Once complete the prompt will show ‘No syntax errors have been detected. Go ahead and click ‘OK’
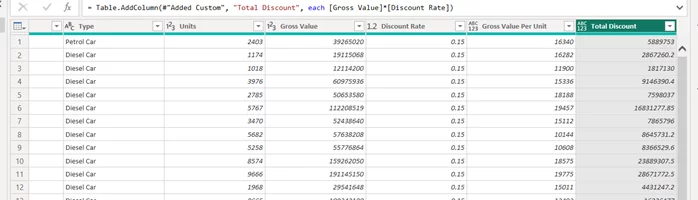
The ‘Total Discount’ Custom Column added to our dataset. The business can now see how much discount we have given to each customer. However, we still need to calculate the Final Value of the car.
Final Value (= [Gross Value]- [Total Discount])
The business asked for the ‘Final Value’ of the car so let us quickly add this calculated field.
To find this out we need to add another Custom Column, as you have guessed we need to subtract the ‘Total Discount’ from the ‘Gross Value.’
To create this custom column, create the name ‘Final Value than double click ‘Gross Value,’ followed by ‘-’ which is the function for multiply, finally double click ‘Total Discount.’
By now you have learnt the simple expressions and should not need the prompt to tell you, go ahead click ‘OK’
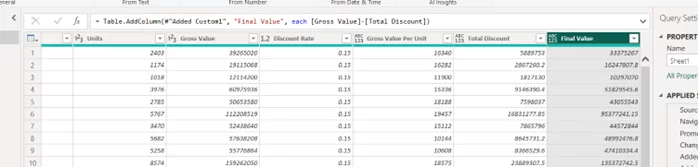
The ‘Final Value’ Custom Column added to our dataset. The business now understand how much it has charged each customer for their car.
Basic Example Dashboard
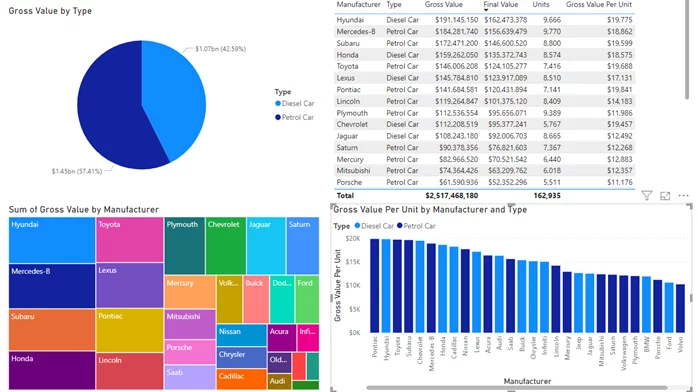
Like the look of the dashboard? Check out this guide on how to create a dashboard in Power BI.
Custom Columns Use Cases
There a many use cases for Custom Columns.
General Metrics
Calculations such as Multiplication, Subtraction, Divide and Addition are some of the most common uses for Custom Columns. These used in conjunction with one another to provide useful data insights such as profitability, rates, averages and much more.
Transformations
Sometimes Power Bi can feel rigid as you cannot freely edit the data, but Custom Columns can usually step in to support the user. A good example here is the ability to split text strings such as First Name and Surnames using the by space, unique characters, or counts function.
Time Formatting and Intelligence
If you have the base Date (MM-DD-YYYY) you can create any time metric your heart desires. Month, Year, Date, Week Num, etc. You can then use each of these Custom Columns to visualise and compare your data Year on Year, Month on Month.
Conditional Columns:
These types of functions allow a user to create Columns based on parameters. A few examples of my favourite Conditional Columns are Greater Than Value, Equal To, Contains and Does Not Contain.
These enable you to categorise dataset easily, are the sales greater than £1M, if so Yes if not No. Does the colour contain Black does it not contain black.
These being a few of the many examples of how Custom Columns can enrich your dataset and overall analysis.
Conclusion
This article has walked us through the Custom Column feature within Power Bi. We have located where to find the Custom Column Function and its overall navigation.
How to create and build custom columns to inform and answer business demands. Finally, we covered off additional functions and user cases for Custom Columns.
Once you have learnt the basics of Custom Column it will open a whole new realm to your data analysis skills within Power Bi, no longer constrained to the foundation data you can now build, edit, transform, and analyse with greater depth and understanding.
As you being to master the feature you will understand that combing these Custom Columns becomes more important than the original dataset itself.
Looking for more on Power BI? Check out this guide to speeding up Power BI!


- Facebook: https://www.facebook.com/profile.php?id=100066814899655
- X (Twitter): https://twitter.com/AcuityTraining
- LinkedIn: https://www.linkedin.com/company/acuity-training/