
How To Recreate Sum If In Power BI!
In this article, you will see how to use DAX (Data Analysis Expressions) in Power BI to implement the Power BI Sum If function.
The Sum If function is used to sum values in a data column based on a specific condition.
It can be used to sum total profit obtained from sales of products if the product category is Technology or Furniture or both.
By default, Power BI does not contain the Sum If function. You can, however, use DAX formulas to implement it; an example of which you will see in this article.
We’ll show you how to use the Sum If function to implement single as well as multiple conditions.
To learn more about DAX, check out our Introduction to Dax article here.
If you’re looking for formal training in Power BI, check the available courses and see which one would suit you best.
Creating A Sample Report
Let’s create our sample report that you will be using to implement the Sum If function in Power BI.
The sample data used to create the sample report is available as a CSV file at the following link:
https://raw.githubusercontent.com/curran/data/gh-pages/superstoreSales/superstoreSales.csv
The dataset contains various information on product sales for a fictional superstore between the years 2009 and 2012.
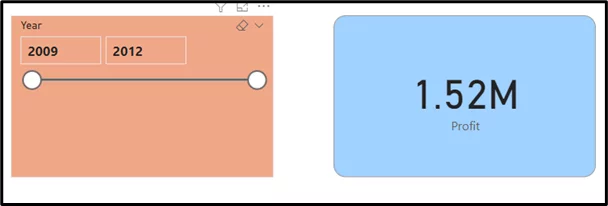
Using the above dataset, you will create a simple report with a slicer visualisation and a card visualisation. The slicer is used to filter data based on years, whereas the card displays the total profit for all the products.
Creating Sum If With A Single Condition Using DAX
In this section, you will create the Power BI Sum If function with a single condition which returns the sum of profits from the sale of different products if the products category is ‘Technology’.
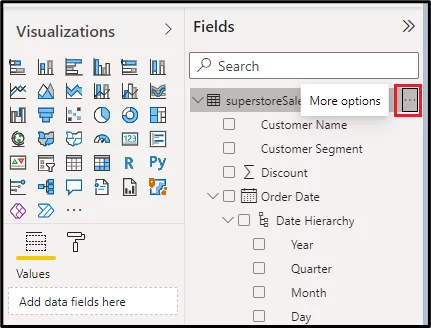
To do so, click the three dots at the top right of your imported dataset in the Reports view, as shown in the screenshot below.
Click the ‘More options’ label that appears.
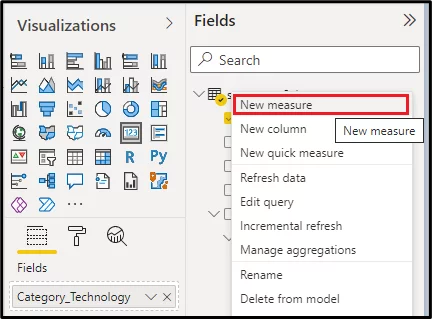
From the list of options, click the ‘New measure’ option as shown below. A measure can be used to implement DAX operations in Power BI.
You will see an empty text field appear below the top menu and at the top of the visuals pane in your reports view. Here is a screenshot for your reference:
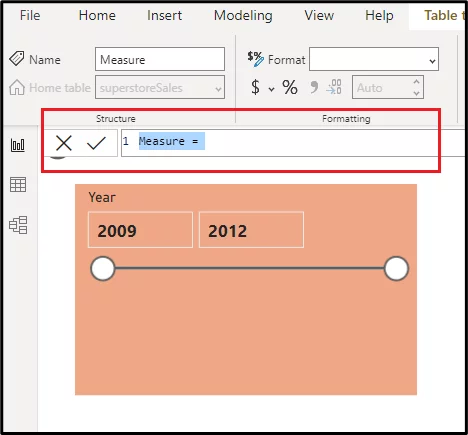
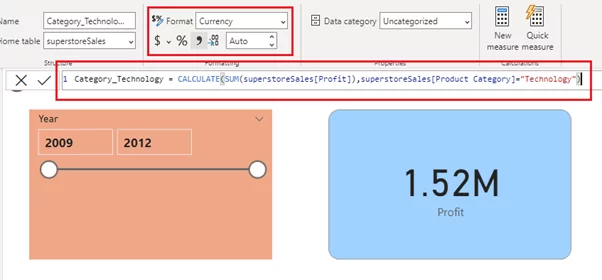
In the text field above, you can write your DAX function that implements the Sum If functionality. Our DAX function looks like the one in the following text box.
| Category_Technology = CALCULATE(SUM(superstoreSales[Profit]),superstoreSales[Product Category]=“Technology”) |
The name of our measure is ‘Category_Technology’. We use the CALCULATE operator to create a DAX function which sums all the values from the ‘Profit’ column of our ‘superstoreSales’ dataset.
Next we specify the If condition which states that we want a sum of the profit only for those products where the ‘Product Category’ equals ‘Technology’.
Hitting the “Enter” button on your keyboard will compile your new measure for the Sum IF DAX function.
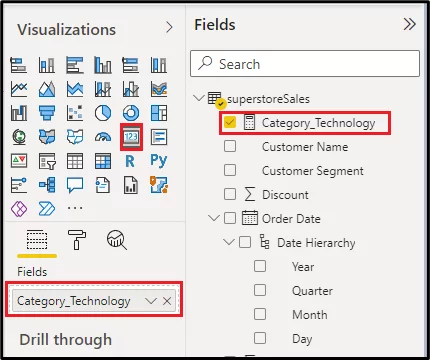
Now if you look at the data fields, you will see that your new measure ‘Category_Technology’ is added to the list of columns.
To see this measure in action, create a new card visualisation and drag and drop the ‘Category_Technology’ measure under the ‘Fields’ option of your new card.
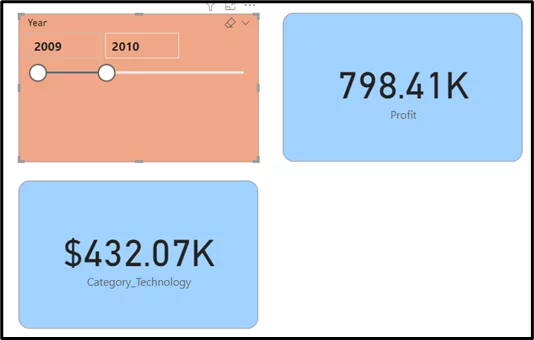
On your reports view, you can see two cards now. The one on the top right displays the total profit between 2009 and 2012 for products from all categories.
The other one (bottom left), which uses the Power BI Sum If function, displays the total profit for the products in the Technology category.
You can also see the currency symbol being used in the card containing the Power BI Sum If function.

You can further filter the records by year using the slicer.
For instance, the following figure shows the total profit and the profit for the Technology category between the years 2009 and 2010.
Creating Sum If With Multiple Conditions Using DAX
You can also use the Power BI Sum If function created via DAX to implement multiple conditions.
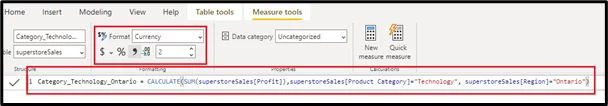
As an example, the following DAX function creates a measure which takes the sum of profits for all the products in the Technology category, with an additional condition that the products are sold in the Ontario region.
You can see that you can separate multiple conditions by simply using a comma ‘,’ in your DAX function.
| Category_Technology_Ontario = CALCULATE(SUM(superstoreSales[Profit]),superstoreSales[Product Category]=“Technology”, superstoreSales[Region]=“Ontario”) |
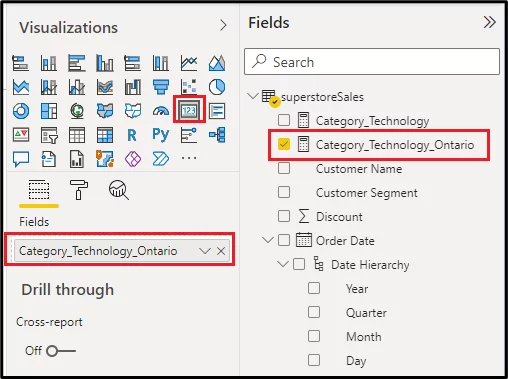
Now create another card using the ‘Category_Technology_Ontario’ measure that you just created.
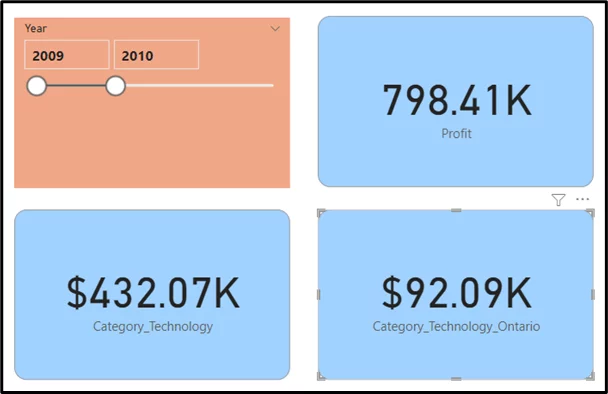
In the output below, you can see another card added (bottom right) that shows the total profit for the Technology products sold in the Ontario region, between the years 2009, and 2010.
Final Thoughts
The Power BI Sum If function is not by default available in Power BI. However, you can use DAX functions to implement the PowerBI Sum If function as you saw in this article.
Though DAX is a useful way for implementing the Sum If function, you cannot use the DAX operations in the Power BI service. Hence, to publish a report containing the Sum If function using the PowerBI service, you should first implement the Sum If function in Power BI Desktop and then import the report to Power BI Service.
For more information on Power BI, try our article about incremental refresh.


- Facebook: https://www.facebook.com/profile.php?id=100066814899655
- X (Twitter): https://twitter.com/AcuityTraining
- LinkedIn: https://www.linkedin.com/company/acuity-training/