
Microsoft Power BI
Our Power BI articles below clearly and simply how to use specific aspects of Microsoft Power BI that we also cover in our Power BI training courses.
AllAdobe InDesignAdobe PhotoshopManagementMicrosoft ExcelMicrosoft Power AutomateMicrosoft Power BIMicrosoft PowerPointMicrosoft ProjectMicrosoft SharePointMicrosoft WordPublic SpeakingSQLTime Management

Customer Case Study: Rennie Grove Peace – Power BI Training – April 2024
Claire Caple – Microsoft 365 Adoption & Change Manager – Rennie Grove Peace “Alpesh was very knowledgeable, and I was confident in his training from the start. He was enthusiastic and excited to help us get to know the software.…
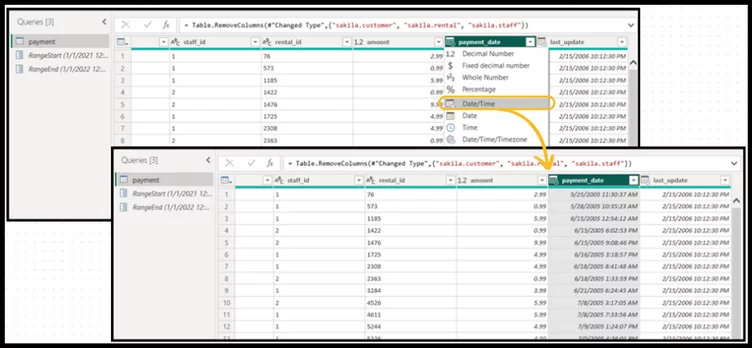
Incremental Refresh – Optimising Power BI
Optimising Power BI reports is crucial when it comes to speed and performance. Incremental refresh allows you to keep historical data (previously loaded data) within your data source and only refresh the data that is changing. Schedule refresh, on the…

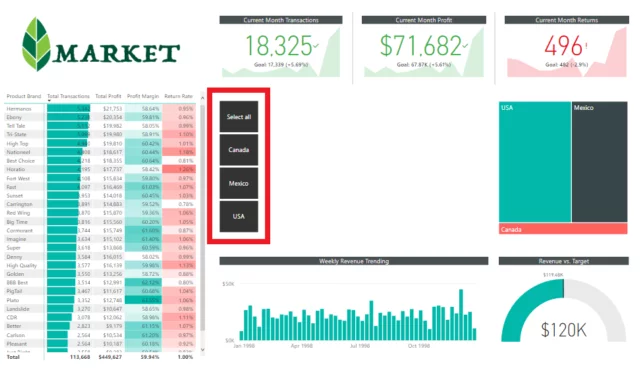
Master The Bullet Chart In Power BI – 5 Minute Guide
A Power BI bullet chart is a more advanced type of bar chart and great for plotting data comparisons. Each bar is shown against multiple qualitative ranges and a target, making it really easy to monitor progress. A bar plot…
The Q&A Visual In Power BI
The Q&A visual in Power BI uses Power BI’s natural language processing engine. It can interpret your question and get an answer from your data. Half of Power BI is learning the best way to present your data using…
Keep Yourself Safe With Row-Level Security in Power BI
In this article, we will look at static row-level security in Power BI. We look at what it is, how to implement it and areas to take care when using it. We find delegates on our Power BI Courses always…
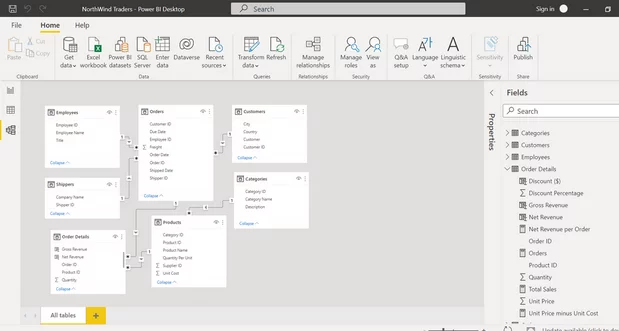
6 Best Practices for Efficient Data Modeling in Power BI
Why do over 62,000 businesses worldwide choose Power BI for analytics? The visuals are simply the best on the market. However, Power BI can be complex and difficult to use, especially for newcomers to the software. This is especially true…
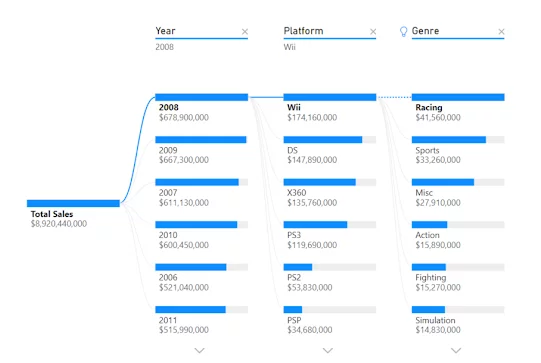
Decomposition Tree Visuals – Quick Guide!
Power BI has a wide range of visuals, both built-in and ones you can download. Many users stick to the tried and tested visuals in their Power BI dashboards, even when they are sub-optimal. Finding the right visual can make…
[Introduction] Automated Machine Learning In Power BI
Automated machine learning is the process of automating the tasks of applying machine learning to real-world problems. AutoML covers the complete pipeline from the raw dataset to the deployable machine learning model. Automated Machine Learning (AutoML) in Power BI for…
Breaking Down Pivot And Unpivot Columns [Power BI Guide]
Learn how to utilize Microsoft Power Query Editor’s pivot and unpivot features in your data queries. Pivoting describes the process of turning distinct row values into columns. Pivot rotates a column from vertical to horizontal. Pivoting data in Power BI…
Introduction to Power BI (Crash Course!)
Power BI is a visualisation and Business Intelligence (BI) tool from Microsoft, aimed at helping turn data into insights. Power BI allows you to stitch together data from across your organisation and create beautiful reports and dashboards. You can connect…

How To Load Multiple Files Into Power BI [Simple Guide]
There are countless ways to load data into Power BI. When you’re learning Power BI, this trick for loading multiple files from a folder at the same time should be near the top of your list – it can save…
Power BI: Which Version Should I Use?
In a world of tiered service offerings and freemium models, the most successful products are those that seamlessly transition between the different levels. This is where Microsoft has done a fantastic job with the 3 different offerings of Power BI.…