
Breaking Down Pivot And Unpivot Columns [Power BI Guide]
Learn how to utilize Microsoft Power Query Editor’s pivot and unpivot features in your data queries.
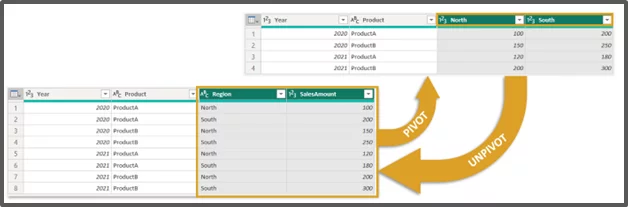
Pivoting describes the process of turning distinct row values into columns.
Pivot rotates a column from vertical to horizontal.
Pivoting data in Power BI helps with visualization, simplify analysis, reporting, and data manipulation!
These columns are also covered in our Power BI Training!
Unpivot Columns
Unpivoting describes the process of turning distinct columns into rows. Unpivot rotates a column from horizontal to vertical.
Unpivoting columns in the Power BI desktop ensure data normalization, enabling you to integrate data from many sources, simplifies data transformation, and improves data modeling.
Unpivoting with Power Query eliminates repeated data transformation on numerous columns, increasing the flexibility and efficiency of your Power BI data models.
The figure below shows you how the pivot and unpivot columns work in Power BI. Now let’s walk through the pivot and unpivot process properly.
How To Pivot Columns
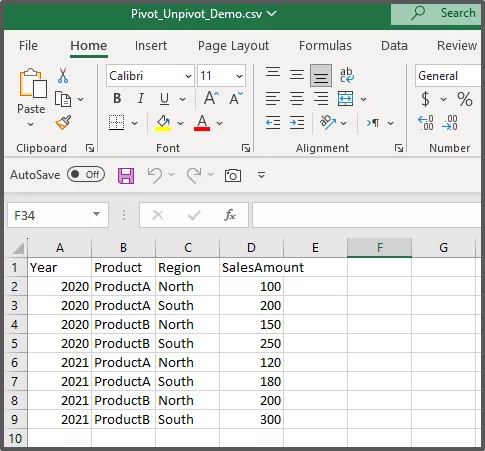
Here is a simplified Sales data record by year by region to demonstrate the pivot operation process.
Assume you’ve connected to the following CSV sales records.
To connect, pivot and manipulate the sales data.
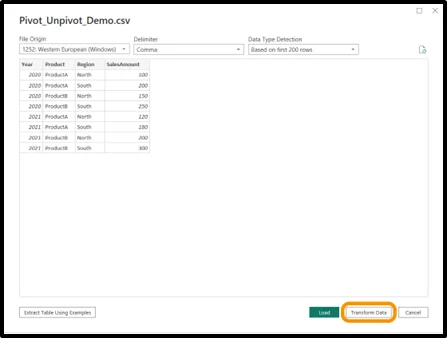
Go to Home > Get data > Text/CSV.

Locate and select the file on your local computer and click on Transform Data.
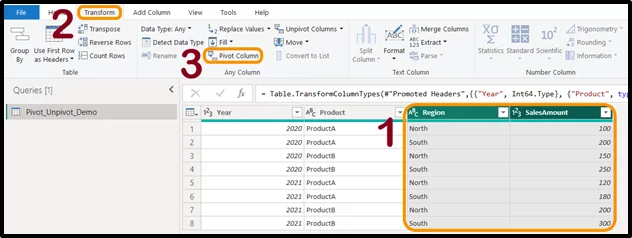
Select the Region and Sales Amount column, by holding down the CTRL key and clicking on each column header.
Go to the Transform tab and click on the Pivot column.
After selecting the Region and Sales Amount columns, and pivoting them, what you’ve done in simple terms is to turn each region (in this demo, we have only two distinct regions) in each row to its column or we’ve used the names in the Region column to create new columns.
Select a column where the cell values for the new columns’ values would come from, in this case, that would be the Sales Amount column, then click OK.
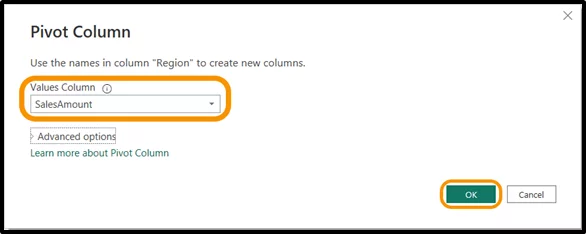
You should have the same result as the figure below.

Looking for something more visual? Read this guide on making Power BI Dashboards.
How To Unpivot Columns
Unpivot in Power BI is the exact opposite of the pivoted result we have in the figure above.
Let’s unpivot the table to revert it to the original structure before we pivoted the column headers of the region and sales amount.
Select the North and South column headers (the pivoted columns), by holding down the CTRL key and clicking on each column header.
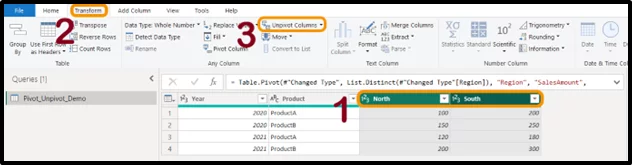
Go to the Transform tab and click on Unpivot column.
The table will be reversed back to this structure below in which the North and South column headers are transformed back to a single Attribute column along with its Values of sales amount.
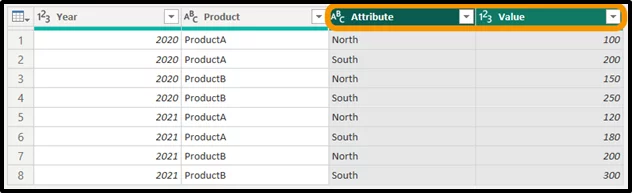
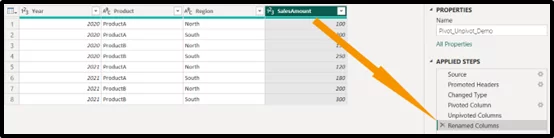
You can double-click on the Attribute and Value columns to rename them better.
Pivot Columns Use Cases
Pivoting columns in Power BI can be super-efficient in various use cases across your organization. It could be helpful in:
Sales analysis, in which you have a sales dataset with each row indicating a product sold in a certain place and month.
By rotating the “Region” column, you may rapidly compare sales across locations by converting the data such that each region becomes a separate column.
This can help in finding high-performing regions, assessing regional patterns, and making informed business decisions.
When dealing with financial data that spans many periods (e.g., months or quarters), pivoting columns might help to simplify the reporting process.
By pivoting time-based columns such as “Month” or “Quarter,” you may create a tabular layout with separate columns for each period.
This makes financial reporting easier by enabling comparative analysis, variance calculations, and trend spotting.
Pivoting columns may be effective in inventory management.
If you have a dataset with product inventory levels for many sites or warehouses, pivoting the location columns allows you to see the inventory levels for each site as separate columns.
This enables quick stock level comparison and analysis, identifying potential shortages or surpluses, and optimizing inventory management strategies.
For another Power BI guide, check out this guide to Creating Gantt Charts!
Unpivot Columns Use Cases
Here are a few examples of when unpivoting columns could be useful: –
Unpivoting columns can aid data integration by combining or integrating data from various sources with distinct column formats.
By combining many columns into a single “attribute” column and a corresponding “value” column, you may create a uniform framework for data integration.
This enables combining and analyzing data from several sources easy.
When data needs be transformed into a star schema or dimensional model, unpivoting columns may be advantageous.
By splitting attribute columns into independent rows, you may create a single column for attributes and related columns for their values.
This enhances the efficiency and variety of the dimensional model for analysis and reporting.
Unpivoting columns can improve data visualization by giving a more acceptable framework for visual representations like charts, graphs, and dashboards.
You may create visualizations that effectively depict the data and its connections by converting multiple columns into attribute-value pairs, making it easier for stakeholders to read and comprehend the information presented.
The importance of visualizations is also explained in this guide: 15 Power BI experts top tips, it’s a key fundamental in Power BI!
Conclusion
Power BI, as a business intelligence platform, has significant data transformation features such as pivoting.
This enables the development of summary views and comparison across categories, and unpivoting.
That then enables data integration and thorough analysis at the attribute and value levels.
It’s critical to note that not all datasets require pivoting or unpivoting.
It’s critical to evaluate whether pivoting or unpivoting would add value and help your data exploration and analysis, but in general:
You’ll always want your data in an unpivoted format for analysis.
Looking for more tips? Check out this intro to slicers in Power BI!


- Facebook: https://www.facebook.com/profile.php?id=100066814899655
- X (Twitter): https://twitter.com/AcuityTraining
- LinkedIn: https://www.linkedin.com/company/acuity-training/