
Speed Up Your Power BI Today!
Contents
Waiting for Power BI if it is running slowly can be incredibly frustrating.
The bad news is that if your Power BI report is slow on the Power BI desktop, it will be even slower when you publish it on Power BI service!
The good news is that you have lots of ways to help when Power BI is running slowly.
Everyone has faced this situation, so if it’s the first time it’s happened to you don’t worry see it as a way to learn more about Power BI.
Work your way through this checklist of things that impact report performance and see it as an opportunity to develop your Power BI knowledge.

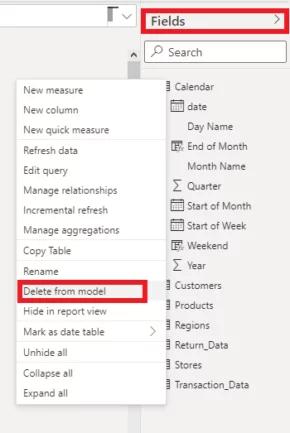
Step 1: Remove redundant columns
Power BI reports are often slow because your data model contains unnecessary tables, columns, or rows that aren’t used in your current Power BI report or Power BI dashboard.
Before you start removing parts of a data model, double-check that you fully understand how it works.
Are you sure that part of the data model isn’t required?
Once you are clear on the data model, remove everything that it doesn’t require.
When working with a large data source, you also need to make sure you are only loading the data you require.
Loading hourly data when you only need daily data or product level transactions when you only care about store-level performance is not a good idea.
Additional data will slow you down.

Step 2: Database normalisation
Database normalisation is the process of reorganising your database’s tables and columns to reduce redundancy while maintaining data integrity.
Normalisation helps to:
- Decrease table size, which improves processing speed and efficiency.
- Minimise errors when you modify your data (inserting, updating, or deleting records)
- Simplify query writing.
A perfectly normalised database will contain tables that serve distinct and specific purposes.
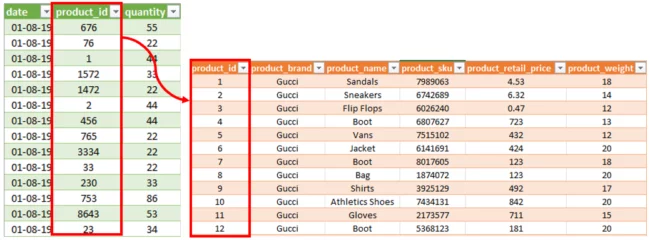
Look at the table below as an example.

If your database isn’t correctly normalised, you’ll end up with tables that look like the ones in the image above, with duplicate values in some of the rows.
Rather than merging data in a single table, you need to create relationships between multiple tables.
This reduces redundant data and saves memory and processing power.
Database normalisation is a big topic and beyond the scope of this article. See this article on database normalisation if you’d like to learn more.
For this article, let’s look at an elementary example.
The critical concept is that data models generally contain two types of tables:
- Data tables:
These tables contain numbers or values which tend to be dynamic or variable in a table.
- Lookup tables:
These tables contain text-based attributes and more static data in a table.
For our table above, we have started the normalisation process.
The data table (Date), which contains quantities that will frequently change, now connects to the lookup table (Product) that contains amounts or values that will change infrequently.
This reduces table size and improves Power BI processing speed and efficiency.
Try to assemble all the data in your model in this manner.
Ideally, you will build a normalised data model as you go along.
Step 3: Use imported columns and avoid calculated columns
Imported columns are faster and superior to calculated columns.
Whenever possible, create calculated columns in the Power Query Editor or at the source (i.e., from your raw database) and then import this data.
This is more efficient than performing the calculations in the data model, which will recalculate them each time the data source refreshes or the column changes.
Power BI uses data from each table row to calculate the values in a calculated column.
Power BI appends static values to each row in a table and saves them in the model, increasing the file size and impacting performance, as it does this.
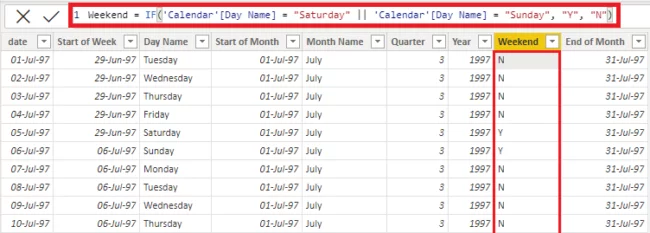
In the screenshot above, the weekend column is a Calculated column created by Power BI using data from each table row.
Wherever possible, create calculated columns in the data source.

Step 4: Minimize iterator functions
Iterator functions (such as SUMX) cycle through each row in a table when they calculate.
As they do so, they create a temporary new column in the table, calculate the value in each row, and then aggregate that new column.
This all takes time and consumes processing power.

Step 5: Query reduction
Connecting to data using Direct Query is the best way to get real-time results.
However, no data is imported or copied into Power BI desktop when using Direct Query.
Each time you interact with a visualisation in a Power BI dashboard or report, you query the underlying data source, which slows Power BI down.
This is particularly true when working with a large or slow dataset.
Helpfully, Power BI contains functionality that helps you to reduce the number of queries.
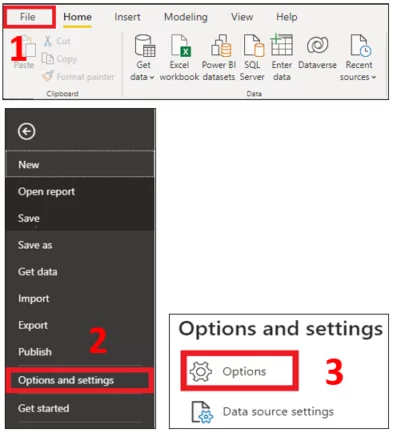
In Power BI Desktop, go to the File tab, select Options and Settings, then select Options and Query Reduction.
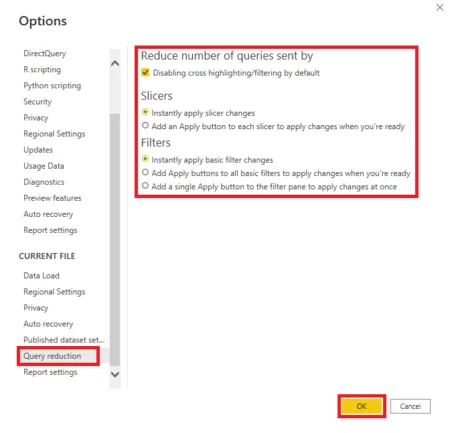
The simplest way to use this functionality is to check the box Disabling cross highlighting or filtering by default.
This option allows you to select multiple slicers and filters on your report before applying them to your report.
Step 6: Performance analyzer
Power BI’s performance analyzer shows you how the items perform in Power BI desktop.
It allows you to pinpoint the performance implications of each item on a report or dashboard’s speed.
In particular, it can show you the hidden cost of measures, which often have a big impact on your performance.
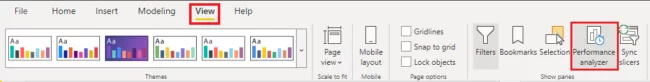
Click on the View tab, Performance Analyzer.
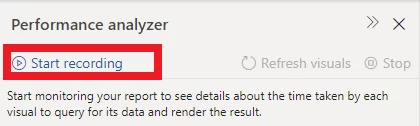
Click on the Start Recording.
You will not be able to see how long (milliseconds) each item in your report takes to load so that you can start optimising the slowest items.
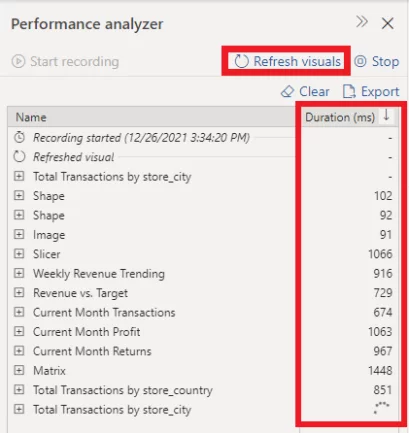
As you can see in the performance analyzer dialogue box, the Total Transaction by Store City, Current Month Profit, and Slicers are the visuals delaying the report the most.
If you are having issues with this Power BI dashboard or report, they are where you can have the most impact on its speed.
In other cases, it will identify which slow queries you need to improve to speed up your Power BI.
Step 7: External Power BI tools
Power BI has a thriving community of BI professionals and developers who create free tools that extend and integrate Power BI Desktop’s data modelling and reporting features using Power BI and Analysis Services APIs.
Some of these tools, such as Tabular Editor and DAX Studio, help you create, maintain and manage models, including help with speeding up models.
External tools can be obtained by registering in Power BI Desktop.
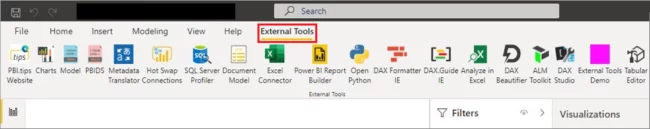
There are lots of external tools available in Power BI. Some of the most well-known are:
- Tabular Editor
- DAX Studio
- ALM Toolkit
- Metadata Translator
Check out this article for more information on external tools.
Final Thoughts
Power BI is a great tool.
If it runs slowly, it is usually a case of optimising the data model.
If you found this article useful, we recommend our piece about incremental refresh. Have a look.
Happy optimising!
Other Power BI Articles
Creating Combo Charts In Power BI
Creating A Bullet Chart In Power BI
Creating Scatter Charts In Power BI
Creating Gantt Charts In Power BI
The Decomposition Tree Visual In Power BI
The Smart Narrative Visual In Power BI


- Facebook: https://www.facebook.com/profile.php?id=100066814899655
- X (Twitter): https://twitter.com/AcuityTraining
- LinkedIn: https://www.linkedin.com/company/acuity-training/