
Creating Word Clouds [Power BI Visuals]
Contents
In this article, we will look at how to create a Word Cloud with Microsoft Power BI.
We will see what a word cloud is, why it is useful, and how to perform various transformations on a Word Cloud.
If you would like to learn more Power BI visuals are covered in our Microsoft Power BI courses.
What Is A Word Cloud?
A word cloud is a diagram that displays a collection of words in various sizes, colours, and orientations.
The sizes of the words in a word cloud usually depends on how often that word occurs in the chosen text.
Words that appear more frequently appear in larger, bolder text.
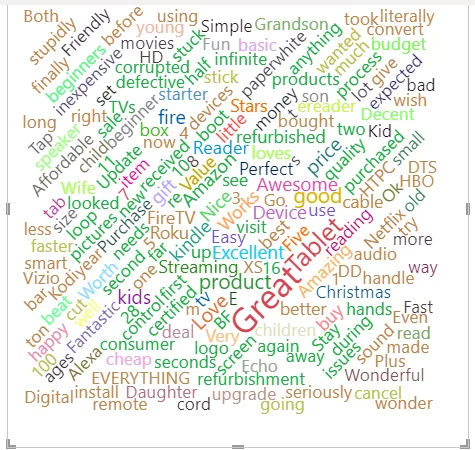
Here is a typical word cloud.
Historically if you wanted this type of text analysis you have to use advanced text analytics libraries such as Microsoft Azure Text Analytics, or IBM Watson. For very advanced text analysis you still need to use these tools as Power BI can not match their capabilities unless you have an enterprise licence. For more details, we have written an article on Power BI licences.
What Is A Word Cloud Used For?
A word cloud is commonly used in text analysis to get a very high-level overview of the vocabulary using in a text.
Examples of how they can be used to include:
- Plotting a word cloud of positive or negative customer reviews to see what the common words used are when customers do or don’t like your product.
- A word cloud of product names from a product sales dataset can reveal a relative comparison of the products with the highest number of sales.
- A word cloud is an excellent way to visualise text insights to an audience with no technical knowledge.
- Word clouds are extremely fast to plot and pleasing to the eye and so useful for presentations.
Including a word cloud visual in a Power BI dashboard is a great way to summarise data for people. Just as a Gantt chart is great for projects and a decomposition tree is great for root cause analysis.
Importing The Word Cloud Visual
By default, Power BI doesn’t contain the word cloud visualization, it is a custom visual.
To access it, you need to import the word cloud visual from Microsoft’s online marketplace.
To do this, go to the Power BI dashboard in Power BI desktop and then click on three dots just below the list of icons for different visualizations you can use.
Click the “Get more visuals” option.
The Power BI marketplace for visuals will open.
Type “word” in the search field.
You will see the “Word Cloud” visual developed by Microsoft Corporation appear.
Click on it.
Next, click the “Get it Now” button.
Once Power BI has downloaded the Word Cloud visual it will appear in the Visualizations pane as shown below.
Importing Data For Our Example
Let’s import a dataset to create a word cloud.
The dataset we will be using can be downloaded from Kaggle.
https://www.kaggle.com/datafiniti/consumer-reviews-of-amazon-products?select=1429_1.csv
The dataset contains Amazon reviews in the form of texts for various products along with other information such as integer rating (from 1 to 5) etc.
Download the CSV file for the dataset from the above link.
In your Power BI dashboard, click the “Get data” option from the top menu and then select the “Text/CSV” option from the dropdown list.
Browse to your downloaded CSV file and open it.
You will see your data displayed, as below, including the column names from your dataset.
Click the “Load” button to load the dataset.
Creating A Simple Word Cloud
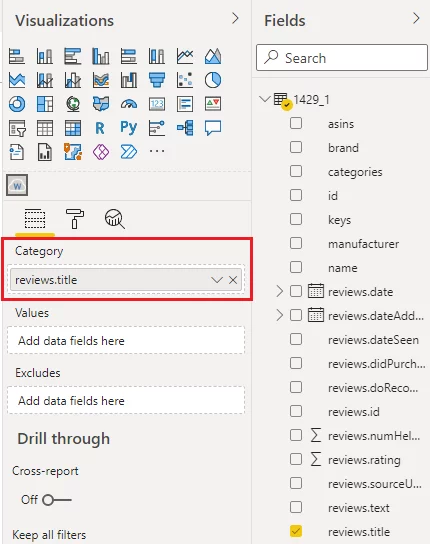
In your visualisations panel, click the “Word Cloud” visual icon.
Drag and drop the “reviews.title” column from the dataset into the “Category” data field.
The “reviews.title” column contains titles of text reviews in the dataset.
In the output, you will see the following.
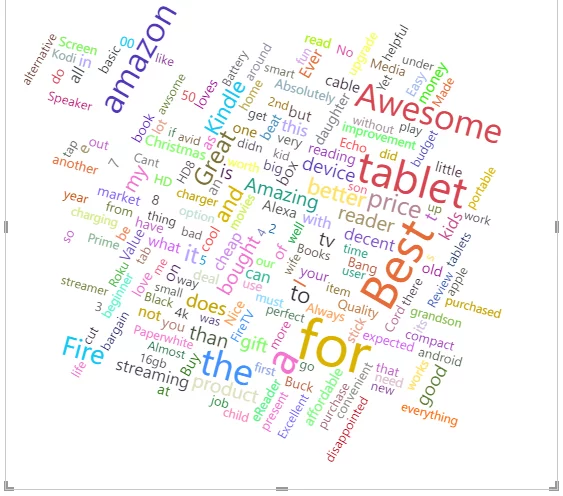
You can see that the words “for” and “Best” occurred in the largest number of review titles as they appear as they are bigger and bolder than any of the other words.
Similarly, the word “disappointed” is very small which shows that this word did not appear in a lot of review titles.
By default, the word cloud is based on the overall frequency of occurrence of words in the complete dataset.
You can create a word cloud based on the information from some other column. For example, a word cloud which uses the sum of the integer ratings for text reviews that that specific word appears in.
Let’s see how you can do this.
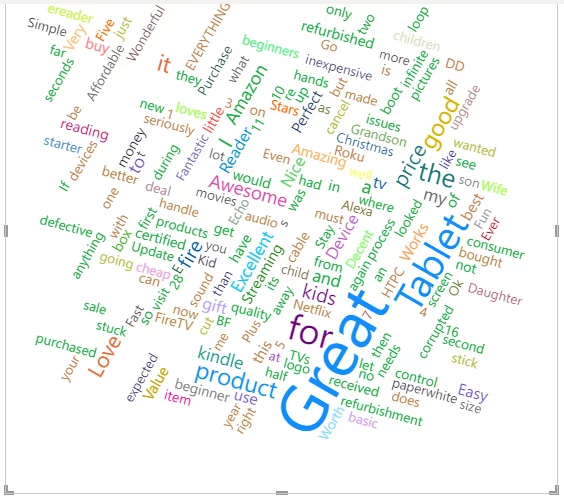
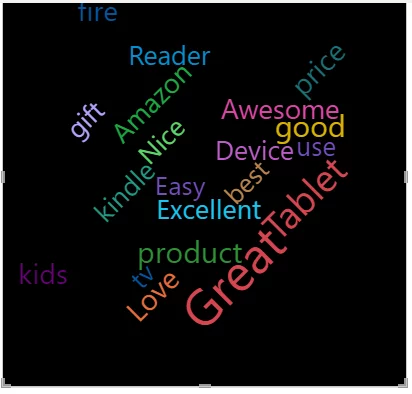
Drag and drop the “reviews.rating” column from the dataset to the “Values” data field of the word cloud visualization as shown below:
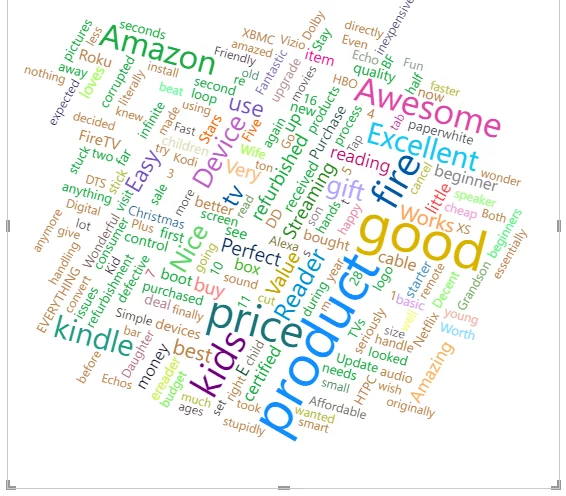
You will see the word cloud below.
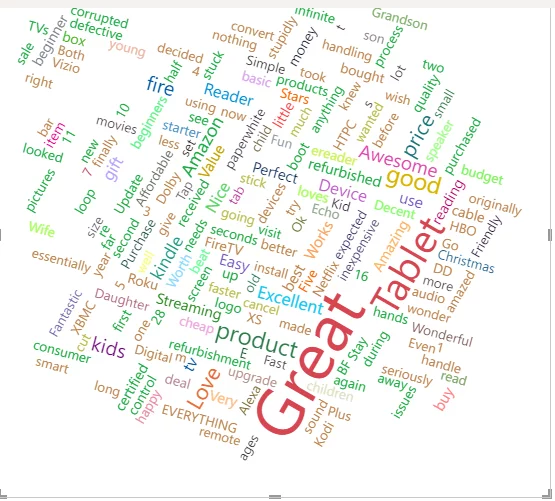
This shows that the words “Great” and “Tablet” appear most frequently in reviews with higher ratings. You would expect “Great” to appear frequently in high scoring reviews.
More useful is the fact that “Tablet” frequently appears in high scoring reviews.
What Are Stop Words?
Stop words are words that occur frequently and don’t convey any meaningful information. For example – “is”, “am”, “for”, “at” etc.
By default, the Power BI word cloud won’t remove a stop word in your data which is why our word clouds above contain these types of words.
Excluding Stop Words
To exclude stop words from your cloud, click on the “Format” option and then select and drag the button to the right of the “Stop Words” option to make it “On”.
Next, to remove default stop words, you need to switch the button for the “Default Stop Words” option to “On“. This removes all the default stop words from your cloud.
You can specify additional words that you would like to exclude.
Simply type them into the “Words” text field separated by spaces.
In the figure below, apart from default list of stop words, we will also remove the following words “one OK Love Great Tablet long”.
Now, if you now look at the word cloud, you can see the default and manual stop words have been removed.
Editing A Word Cloud
Let’s now look at some options to edit the default word cloud in Power BI.
Changing Colours
To change the colours of the words in your word cloud, select the “Data colors” option from the “Format” field.
You can now specify colours for all the individual words in your word cloud.
Here is how your word cloud looks after you update the colours:
Changing The Orientation of Words
You can also change the orientation of words in your word cloud.
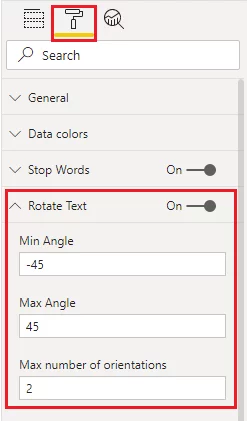
Go to the “Format” > “Rotate Text” option.
Enter the values in degrees for the minimum and maximum angles you would like words displayed at.
You also need to enter an integer value for the maximum number of orientations.
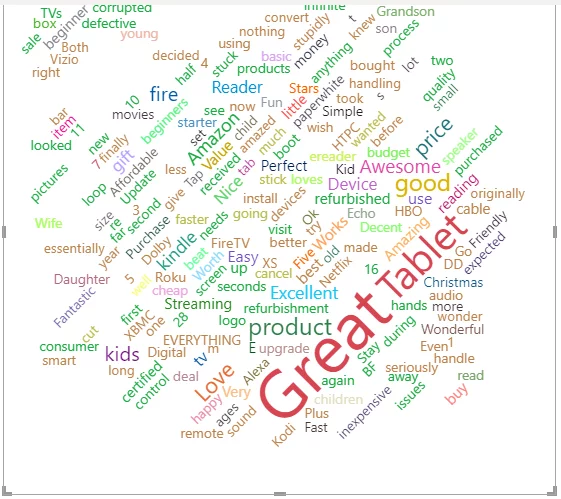
In the figure below we have set the minimum and maximum angle values to -45 to 45.
Power BI will then choose two orientations at random between the maximum and minimum figures set.
Here is the output after you change the orientation of your word cloud.
Changing Font Size
To change the font size of our word cloud, enter the minimum and maximum font size values in the “Min font size” and “Max font size” fields, respectively.
These values are obviously relative to the average size.
The default values for minimum and max font sizes are 20% and 100% respectively.
The following figure updates the minimum font size value to 50%.

Since the minimum font size has been increased and the maximum font size kept the same, the words will appear more cramped and pushed together as they take up more space.
They will also appear more similar in size.
Limiting The Number of Words
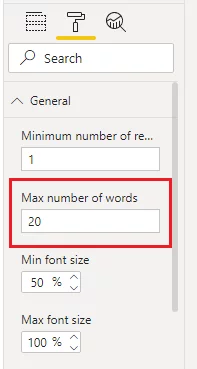
You may want to change the maximum number of words that appear on your word cloud so that the words that do appear are clearer.
These settings can be found in the “Format” section.
The default value is 200, but in the example below we have reduced this to 20.
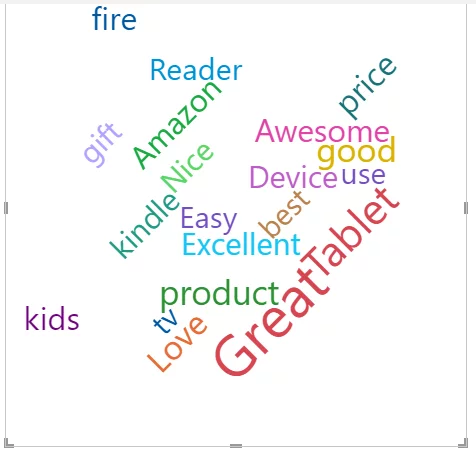
In the output below, you can see that only the 20 most frequently occurring words appear in your word cloud.
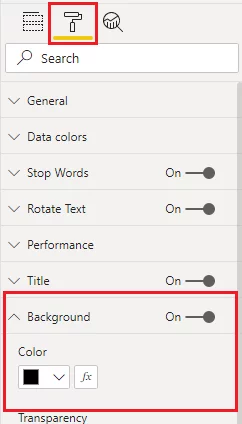
Changing The Background Colour
Finally, you can also change the background colour of your word cloud in the “Format” options.
Here is how your word cloud looks once you change the background colour.
As you can see depending on the colours of your words different background will make different words stand out more or less.
Final Thoughts
The Power BI word cloud visual can be extremely useful, especially when producing visuals to be exported to PowerPoint.
It gives you a high-level overview of your text very quickly and simply, and can easily be added to reports or dashboards.
Word clouds are handy as they can be easily understood by non-technical audiences as well.


- Facebook: https://www.facebook.com/profile.php?id=100066814899655
- X (Twitter): https://twitter.com/AcuityTraining
- LinkedIn: https://www.linkedin.com/company/acuity-training/