
Power BI: Which Version Should I Use?
Contents
In a world of tiered service offerings and freemium models, the most successful products are those that seamlessly transition between the different levels.
This is where Microsoft has done a fantastic job with the 3 different offerings of Power BI.
In this article, we will look at the main differences between the three offerings, and why you might choose one over another.
If you would like detail on what Power BI exactly is and how it is used see our article: What Is Power BI?
The 3 different Power BI offerings are Desktop, Pro, and Premium.
As you move from Desktop to Professional, and from Professional to Premium, you unlock additional features. Explaining this is often a beginners Power BI interview question.
Should I Use Power BI Desktop?
While Power BI Desktop may be the introductory tier for Power BI, it has everything you need to get started with reporting, visualizations and analytics.
Unlike some competitors in the BI space that offer watered-down versions of their products for free or trial versions, Power BI Desktop is fully featured even though it is free.
Power BI Desktop has a large list of features, the key ones include:
- Connecting to your data is made very easy as Power BI supports hundreds of data sources (on-premise and cloud) such as SQL Server, Dynamics 365, Salesforce, Azure SQL DB, Excel, and SharePoint
- Data modelling and prep can be done using Power Query to ingest, transform, integrate and enrich data. You will have all the tools at your disposal to get your data ready to use.
- There are many ways you can utilize advanced analytics in Power BI. From using DAX (Data Analysis Expressions) or utilizing your own R code, you have many options to enhance your analysis.
- Interactive visuals allow for drilling down into your data easily and quickly. Interactive visuals enable a new level of self-service reporting.
- You can tailor your designs for computers and/or mobile devices to ensure your reporting looks great on any device.
- The update schedule for Power BI is monthly, so new feature updates are continually rolled out to improve the core product.

Use Cases for Power BI Desktop
Power BI Desktop is a versatile tool that can be used in many different settings such as businesses, schools, non-for-profits/charities, and even for personal use.
What makes Power BI unique is that most people are familiar with Excel, so while there is a learning curve, it is much smaller than with other similar tools.
I bet this will sound familiar. You are getting tired of wrestling with Excel on a monthly basis to make it produce updated visually appealing and professional-looking reports or dashboards.
The amount of time you spend each month finessing the formatting or making the data display properly in Excel is frustrating to put it politely.
This is the perfect opportunity to give Power BI a try and see what it can do. It will offer all the features you are used to in Excel and much more, more quickly.
This isn’t the only scenario, but it is a common one. Whatever your use case, you will be surprised at how seamlessly you can create high-quality visuals with minimal effort.
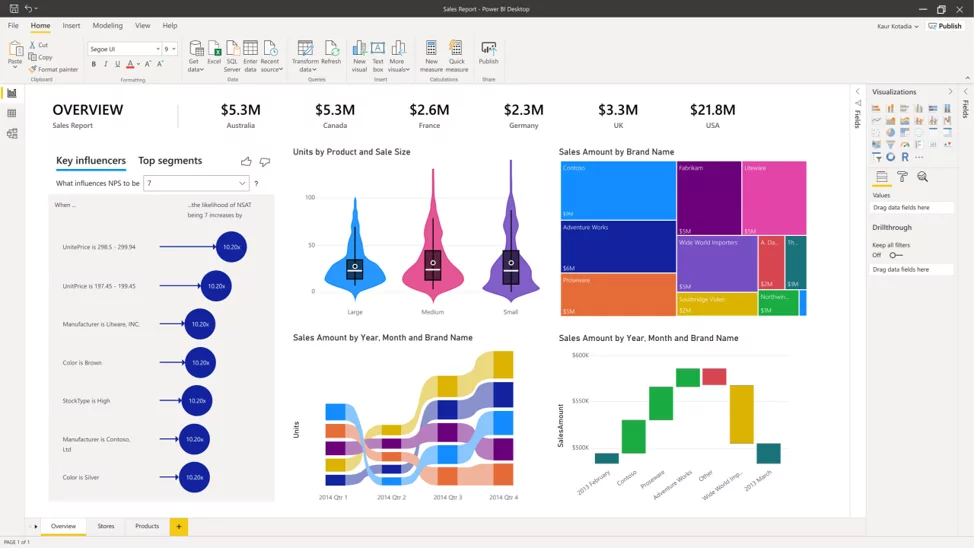
Image via Microsoft
February 2024 Update: Please note that you can only apply themes using Power BI Desktop!
If you have an existing report in Power BI service then you can’t apply a theme to that. See this article on Power BI themes for more details.
Should I Use Power BI Pro?
Taking a step up from Power BI Desktop to Power BI Pro allows organizations and individuals a few additional capabilities for a cost of just $10 per user per month.
One of the biggest additions of Pro is the ability to share and collaborate.
Users can publish content to a workspace and share it with others who also have a Power BI Pro license.
Other users can subscribe to your reporting, view it, and then use your visuals in their own reports, depending on the privileges you grant them.
This is especially helpful when creating departmental or organizational dashboards.
You do not have to recreate visuals, you can simply reuse existing visuals that are already being updated by someone else.
This article – comparing power bi dashboards vs reports – explains the difference between the two if you are unsure.
Use Cases for Power BI Pro
Once your organization begins to use Power BI Desktop, adoption will naturally begin to increase over time.
This will mean that reports and dashboards will be scattered across computer desktops, network file folders and emails.
Redundancy and duplication will begin to increase as information silos form and sharing only occurs inside specific departments or groups.
This is the point where upgrading to Power BI Pro is extremely valuable.
It allows you seamlessly share reporting across your organization and allow others to interact with it.
Setting different permissions on the individual users allows the author to ensure that others cannot impact what they have built and ensure that data in Power BI is secure.
This begins to build trust in the data and reporting as everyone can access the gold standard reports and also reduces duplication hugely.
At the price point of $10 per user per month, this is inexpensive when compared to the productivity gains achievable.
Should I Use Power BI Premium?
Power BI Premium is the enterprise-level tool. It is licensed by computing power, meaning you pay for the amount of power/speed your organisation will need based on your usage expectations.
There are a few key differences between Power BI Pro and Premium, which include:
- Widespread distribution of content to data consumers, without the need for Pro Licenses
- A number of increases to usage limits, such as dataset size, storage, and data refreshes
- Store Power BI data in Azure Data Lake Storage Gen2
- AI-powered data modeling using AutoML, Cognitive Services, and Azure Machine Learning
Where Power BI Premium really shines is its integration with the Azure. Azure is the cloud offering from Microsoft that allows many additional services to run on top of Power BI. There are a number of different big data services that can be integrated into your reporting and analytics projects.
Use Cases for Power BI Premium
In many cases, the decision to choose Power BI Pro vs Premium is driven by how many people in your organization will be interacting with Power BI.
The big difference is that Power BI Premium doesn’t require licences for individuals who only view the reporting.
For larger organizations that have hundreds of people consuming but not creating reports, it is often more cost-effective to go with Power BI Premium.
Microsoft provides a calculator to help you understand what makes the most sense.
In addition, as your organization continues to mature with data and analytics, you will get to a point where advanced analytics will make your workflows easier or more effective.
The AI options (including automated ML capabilities) within Power BI Premium provide a great launchpad to get your organization started with AI and so moving to a Premium subscription at that point obviously makes sense.
Final Thoughts
Power BI is a fantastic tool to get you started or to help you advance your data and analytics journey. Even with large amounts of data it runs very quickly.
Microsoft has done a great job of developing a product that can grow with you and your organization no matter what stage of maturity you are at. If you are serious about rolling out and using Power BI it is worth learning DAX on your to do list, it is hugely powerful.
If you would like to know more about Power BI, we recommend the article about Power BI datamarts where you’ll learn what they are and why you should use them.


- Facebook: https://www.facebook.com/profile.php?id=100066814899655
- X (Twitter): https://twitter.com/AcuityTraining
- LinkedIn: https://www.linkedin.com/company/acuity-training/