Sharing Reports & Dashboards In Power BI
A Workspace is a place where you can work with your team, creating dashboards, datasets, dataflows and reports.
Initially you will have access to your own personal workspace, called My Workspace, this enables you to work with your own content, to which only you have access and no one else.
Creating additional workspaces allows you to group together specific data applied to a task/project and give access to the team which will need to view and work on this data.
You can learn about workspaces, dashboards and a lot more in our Microsoft Power BI courses.
Creating A Workspace
Within the Power BI Service Navigation bar, select Workspaces and click Create a Workspace.
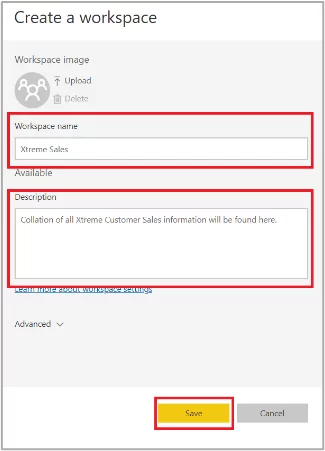
Within the Create New Workspace dialogue, enter the Name and Description as required and click Save. Start adding content to the Workspace as required.
Accessing The Workspace
With the new Workspace added, the only user who can access it will be the admin – which is normally the person who created it. To allow others to have access to the workspace, do the following:
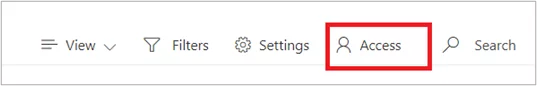
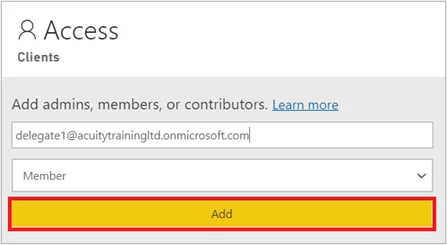
Select the Access button in the top right corner of the Workspace.
For each user being given access, individually enter their email address and select which type of access they require.
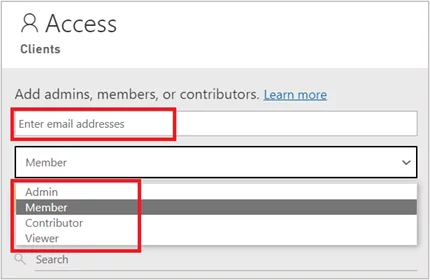
Click the Add button to apply the user. Repeat the process for all other users requiring access to the Workspace.
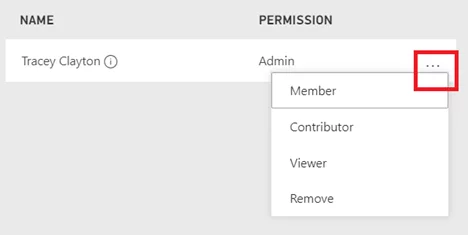
If you need to amend a user’s access or even remove a user, click the More Options button to the right of the user name and select as necessary.
Publishing Power BI Reports
Within your Power BI Desktop or Power BI Report Builder application, to publish the current report follow these instructions:
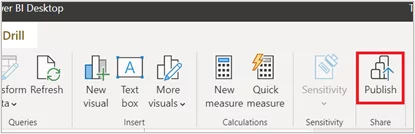
Click on the Publish button from the Home Ribbon.
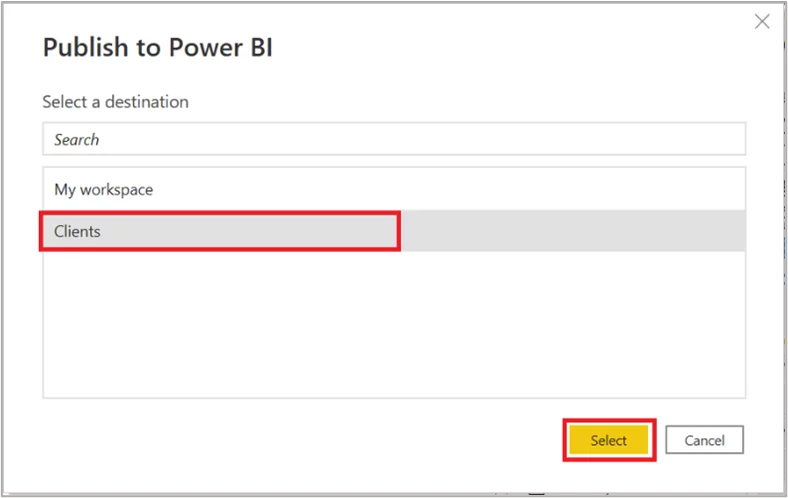
Select which Workspace you wish to publish the report to.
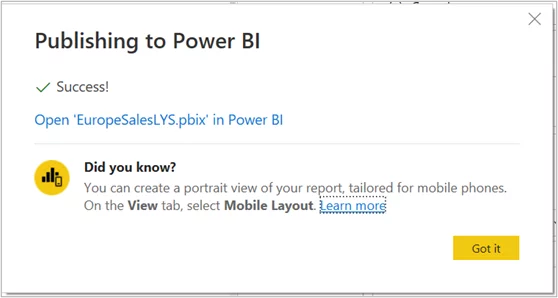
You will see a message confirming the publication.

Power BI Dashboards
Often called “Canvas”, a Power BI Dashboard is a single-page interface filled with the most important and critical data from various related reports, immediately available in a single glance.
The visualisation of data on the dashboard is called Tiles. These are organised to represent different datasets, to give you an overview of the story you are trying to create from the detailed Power BI Reports.
Creating A Dashboard
Dashboards are created on the Power BI Service page. Login to your Microsoft 365 Account and load the Power BI app.
Within your navigation panel, select the Workspace you wish to add the dashboard to.
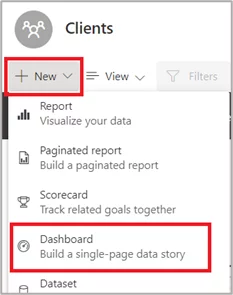
Select the New button and click on Dashboard
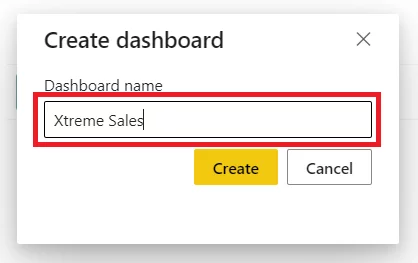
Enter the name for your Dashboard and click Create.
The Dashboard is created and ready for you to start adding information from your reports to the canvas.
Adding Tiles To A Dashboard
Each Dashboard is made up of Tiles – these can be either visualisations from a Power BI Report, text items, web content, videos or images. You will select items that will give you an overview of the content, which a user can then select to link through to the entire Report.
To add a Power BI Report visualisation, select the following:
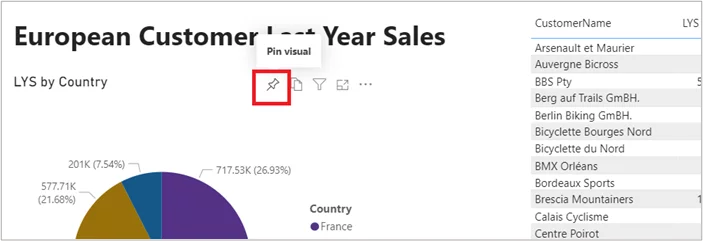
Open the report in the tool of choice and locate the visualisation to be added. Click the Pin button.
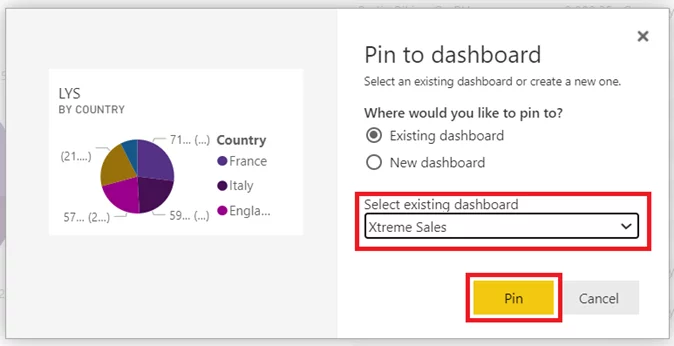
Select the Dashboard you want to add it to – you can even create a new Dashboard at this point if necessary – click the Pin button to add.
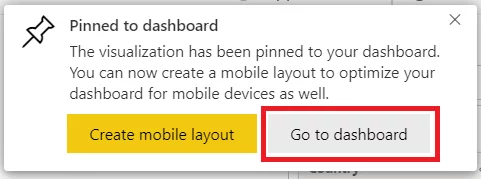
A message will confirm that the visualisation has been added. Either close the dialogue box and continue to pin items or select Go To Dashboard to view the result and re-organise the tiles if necessary.
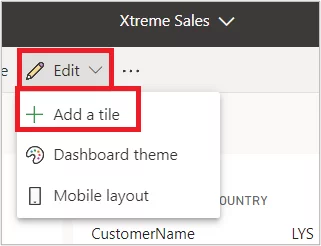
To Add non-report Tiles to your Dashboard, first view the Dashboard within the Power BI Service environment.
Select the Edit button at the top of the Dashboard and click + Add a Tile.
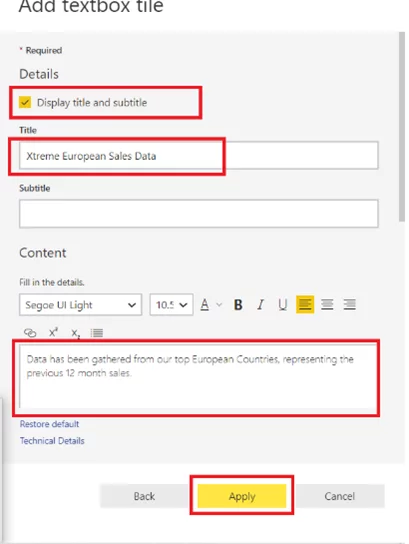
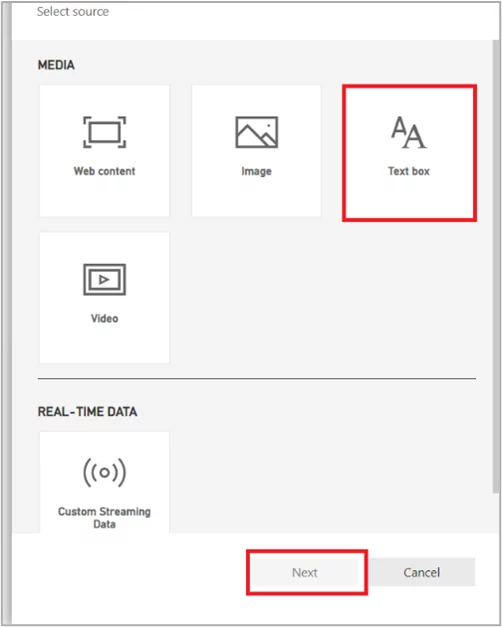
Choose the style of Tile – in this example we are going to use Text, click Next to continue
Add the detail required. We are using a Title and Content below. The formatting can be applied to the content details – click Apply to add the tile