
Using The Key Influencer Visual [Power BI Visuals!]
In this article, we look at creating a Key Influencer visual in Microsoft Power BI.
We will see what a key influencer visual is, when it is valuable and look at its limitations.
Our online Microsoft Power BI training courses cover Power BI visuals in detail.
What Is The Key Influencer Visual?
The key influencer visual contains two tabs.
Tab 1: Key Influencers Tab
The Key Influencer visual allows you to understand how various metrics impact a selected statistic in your data.
It analyses your data and determines which are the most impactful individual contributing factors are and how significant their impact is.
The key influencers visual also allows you to understand the relative importance of the different significant factors that it finds.
The visual uses linear regression, logistic regression and decision trees to produce these insights into your data using Power BI’s machine learning and AI capabilities.
In this article, we will be using the Titanic passenger list.
If you would like to follow along, you can find the dataset here.
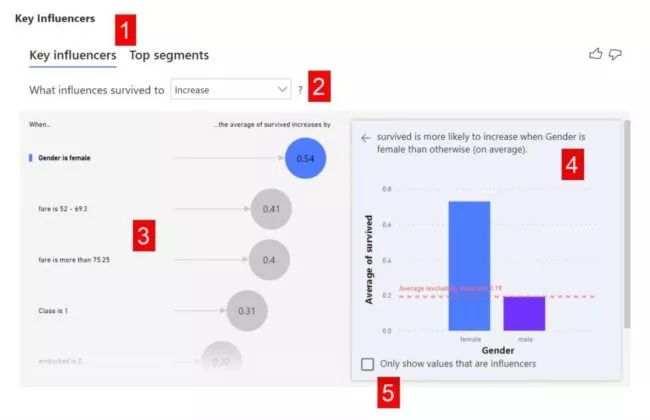
There are five main sections of a Key Influencers visual:
1. Tabs:
There are two different tabs, Key Influencers and Top Segments.
The Key Influencers tab shows how individual factors affect the metric you are analysing.
Top segments, which we look at in more detail below, shows your data by individual segment or category.
2. Drop-down box:
This is a selectable option.
It allows you to select whether you’d like to look at variables that increase or decrease the statistic of interest.
In our example, we have selected the option to understand which factors contributed to more passengers surviving the sinking of the Titanic.
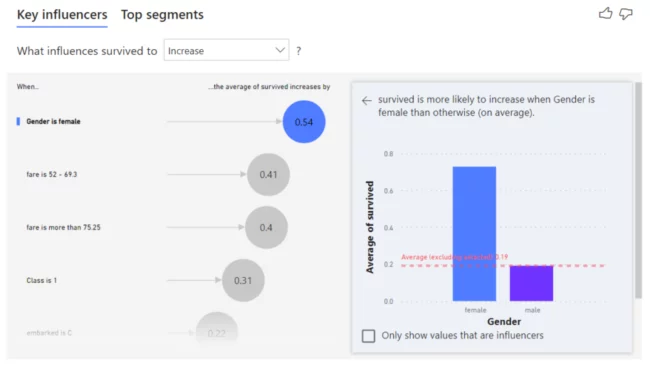
3. Left pane:
The left pane lists the individual key influencers and their level of impact.
In our example, you can see that if a passenger was female, that increased their chance of surviving the Titanic sinking by 54% (0.54).
4. Right pane:
The right pane provides a graphical analysis of the selected influencer in the left pane.
In our example, you can see that males had a 20% (0.2) chance of survival, while females had a 74% chance of survival.
This shows where the increase of 54% on the left pane has come from.
5. Checkbox:
The checkbox is a filter that lets you show or hide items that are not determined to be key influencers.
Tab 2: Top Segments Tab
The Top Segments tab provides a detailed view of any segments that Power BI has identified.
Our example shows the three segments that had the highest chance of survival.
Segment 1 had a 97% (0.97) chance of surviving. This segment contained 75 people.
You can see that Segment 2 and Segment 3 have different population sizes and chances of surviving.
The size of the circles is proportionate to the overall population count.
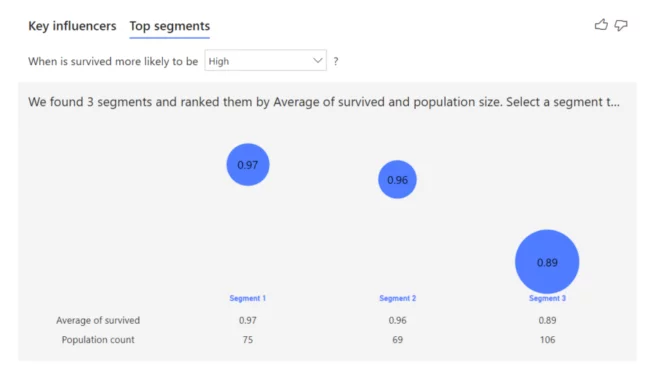
You can take the visual one step further by clicking on one of the circles.
Doing this will drill down into the data and give you the details of that segment.
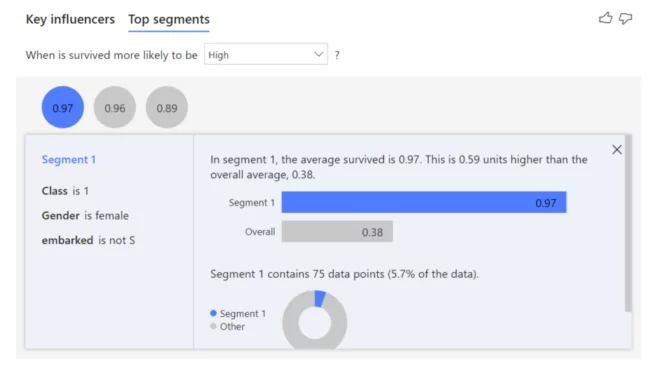
Three criteria define Segment 1:
-
- Ticket Class: First Class
- Gender: Female
- Embarkation Location: Southampton
You can also see that 97% of passengers in this segment survived versus 38% of passengers overall and that this segment comprised 5.7% of the total population.
When Should I Use The Key Influencer Visual?
The Key Influencer visual is well suited for analysis when you know the question you would like answered but have no experience suggesting the correct answer.
Our question was, “What influenced whether passengers survived the sinking of the Titanic?”.
Power BI quickly allowed us to see the key influencers of this outcome and drill down into individual key influencers to understand them in detail.
Your question might be, “What factors caused the increase in spending on XX?”.
In that case, you could analyse your data using total spend and put all of your other data into the “Explain by” section when you are setting up the visual. See below for more details.
This will highlight any patterns that Power BI can find between spending and your other data.
Creating A Key Influencer Visual In 4 Steps
Creating a key influencer visual is straightforward.
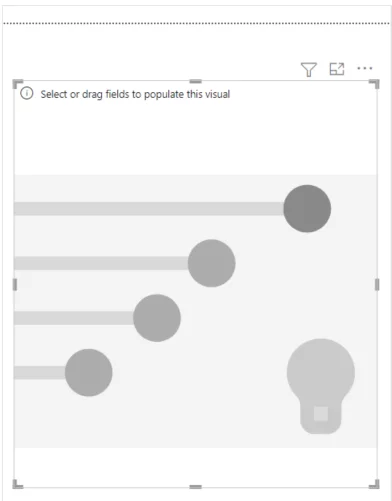
Step 1: Add the Key Influencer visual
Assuming you already have your data loaded into Power BI, you can go to the visualisations pane and click on the key influencers icon.
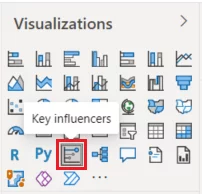
A blank visual will be added to your report.
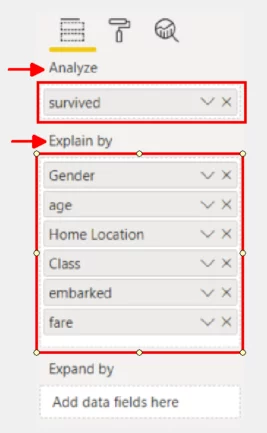
Step 2: Adding Data
You can now add data to your visual in Power BI desktop.
The metric you want to understand goes in the “Analyze” field. In this case, it is “survived”.
The data you want Power BI to interrogate to see if it can find a relationship should be added in the “Explain by” field.
As you add data, you will see your visual change and start to identify the key influencers.
Don’t be afraid to add lots of different fields to the “Explain by” section.
The beauty of Power BI is that it does the heavy lifting and determines what is important.
Fields that do not impact your metric will simply not appear in the Key Influencers visual.
Leave the “Expand by” field empty.
When analysing a measure or summarised field, you need to use “Expand by”.
Step 3: Use the Key Influencer Visual
You should now have a visual that looks similar to the below.
Note: The visual defaults to “Increase” in the drop-down box. The analysis can be carried out for “Decrease”, but you will need to set that up manually.
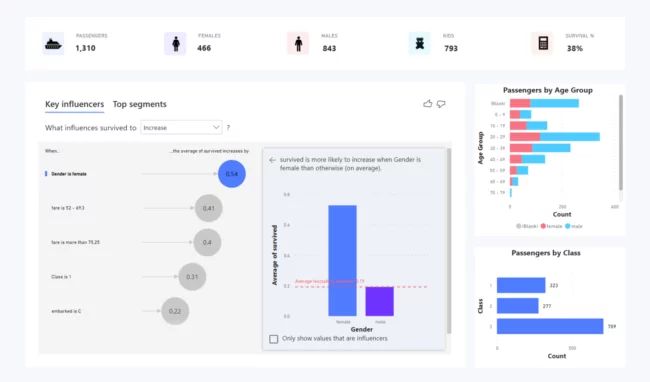
Step 4: Complete your report
You will notice that the Key Influencer visual interacts with other visuals or slicers in your dashboard as you would expect.
Limitations Of The Key Influencer Visual
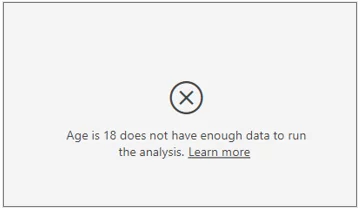
The most significant limitation of the key influencer visual is that it needs plenty of data to work. It does not work with small datasets.
The Key Influencer visual looks for patterns but struggles to generate insights from small datasets.
Microsoft suggests datasets of at least 100 observations, including 10 for each category you want to interrogate.
If your dataset is too small, you will see this error.
Also, the Key Influencer visual is not supported when using:
- Direct Query
- Live connections to Azure Analysis Services and SQL Server Analysis Services
Finally, you can not publish a key influencer visual to the web or embed it in SharePoint Online.
Historically, Microsoft has improved the support and usability of new visuals over time, so these restrictions are likely to fall away in due course.
Conclusion
The Key Influencers visual in Power BI is extremely powerful for analysts and one that everyone should learn.
It provides a no-code option to run machine learning models in Power BI on your data.
For businesses that are struggling to get into leveraging AI, this is a fantastic start.
Articles On Other Power BI Visuals
Creating Combo Charts In Power BI
Creating A Bullet Chart In Power BI
Creating Scatter Charts In Power BI
Creating Gantt Charts In Power BI
The Decomposition Tree Visual In Power BI


- Facebook: https://www.facebook.com/profile.php?id=100066814899655
- X (Twitter): https://twitter.com/AcuityTraining
- LinkedIn: https://www.linkedin.com/company/acuity-training/