
Microsoft Excel
Our Excel articles below show clearly and simply how to use specific aspects of Microsoft Excel. We also cover these in our Excel training courses.
AllAdobe InDesignAdobe PhotoshopManagementMicrosoft ExcelMicrosoft Power AutomateMicrosoft Power BIMicrosoft PowerPointMicrosoft ProjectMicrosoft SharePointMicrosoft WordPresentation SkillsSQLTime Management
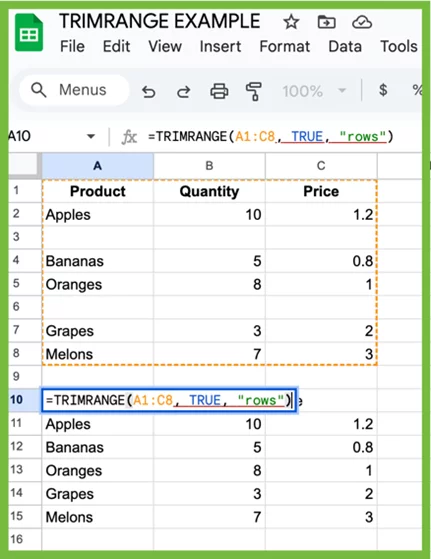
TRIMRANGE Function In Excel
The TRIMRANGE function in Excel is used to automatically remove blank rows, columns, or both from a specified range. It’s especially useful for cleaning up data before feeding it into formulas, charts, pivot tables, or dropdown lists. TRIMRANGE helps ensure…
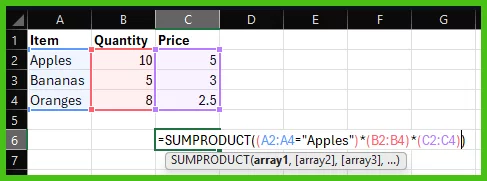
Using Excel’s SUMPRODUCT Function
The SUMPRODUCT function is a powerful Excel tool that multiplies corresponding numbers in two or more arrays and then adds those products together. Think of it as completing two operations—multiplication and addition—in one elegant step. It’s especially useful when you…

Mastering The Focus Cell In Excel
In recent updates to Excel for Microsoft 365, a subtle but powerful feature has been rolled out — the Focus Cell. This tool helps you instantly identify where you’re working by visually highlighting: The active cell It’s entire row and…
Excel Statistics: Facts & Figures [Original Research]
To inform how we teach our Excel training courses, we have conducted new, original research. We wanted to know just how many people are using Excel, and how confident they are with it. For full details of our sample size…

Transform Your Excel Data [8 Easy Methods!]
Data is crucial for your business. It offers insights into customer behaviour, and supports predictive forecasting for future product trends. However, raw data is rarely usable as-is. Issues such as missing values, duplicates, or errors can render datasets unreliable. To…

Excel’s SUM Function [inc 2 Examples & Troubleshooting]
The SUM Function quickly adds up numbers in a range of cells. It’s simply how adding in Excel is handled! It’s a simple and powerful tool, taught in our intro to Excel course. SUM Function Details Available in: All…

Excel’s TRIM Function [inc 2 Examples & Troubleshooting]
The TRIM Function in Excel is useful for removing extra spaces from text. It’s especially handy when cleaning data imported from other sources. TRIM Function Details Available in: All versions of Microsoft Excel User Level: Beginners Inputs: “Text”: The…

Excel’s COUNT Function [With 2 Examples & Troubleshooting!]
The COUNT Function in Excel quickly counts the number of cells in a range. It simplifies data analysis by providing a fast way to quantify numeric data in your spreadsheets. COUNT Function Details Available in: All versions of…
Import Data To Excel With Power Query! [2 Step-By-Step Examples]
Power Query transforms data and makes it usable. You can import any data into a Microsoft Excel sheet and then transform it for your needs. This includes adding or deleting columns, filtering data, changing the data type, merging tables,…

Why Should You Learn Excel?
Excel is more than just a spreadsheet program. It is an essential tool to and can guide your way to success. No matter which field you work in or plan to work in, you should master your Excel skills.…

Top 10 AI Excel Tools – Reviewed & Ranked
Over half of the modern world is using AI at work. If you’ve not used it before Excel spreadsheets are a great place to start. But which one should you use? We decided to test the top 10 AI Excel…

2 Ways To Make A Heat Map In Excel [Advanced Guide]
Heat Maps distinguish important figures through vibrant colours. They are a unique visualisation tool, they are approachable while keeping important data intact. On our advanced Microsoft Excel courses, you’ll learn all about heat maps with the help of our…