
News & Tips
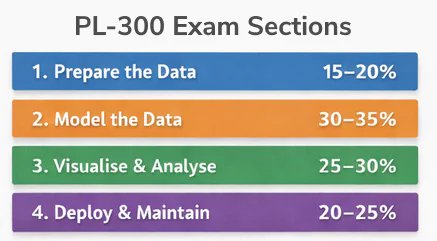
PL-300 and Our Power BI Training
If you are looking to pass the PL-300 Microsoft Power BI Data Analyst exam, you are probably wondering: Do Acuity Training’s Power BI courses actually prepare me for the exam? At Acuity Training, we do deliberately map our course content…
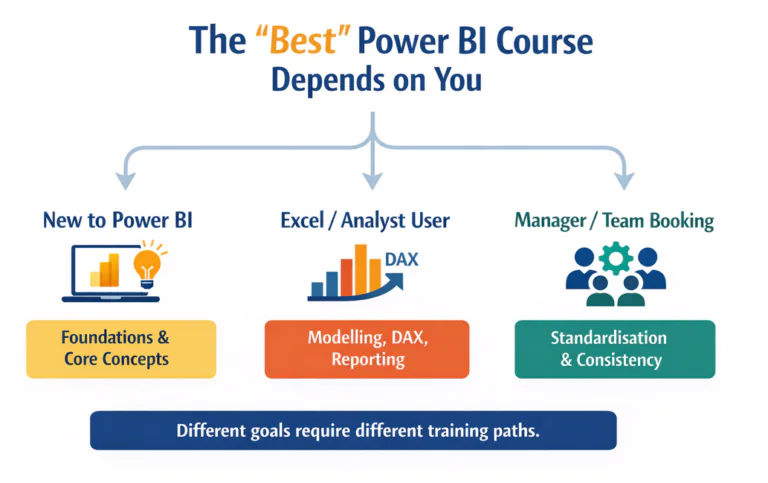
How To Pick The Best Power BI Course In London
If you are looking for the “best Power BI course in London”, you’ll find loads of different businesses, all telling you that they are the one to trust. However, there isn’t just one Power BI course that everyone should go…
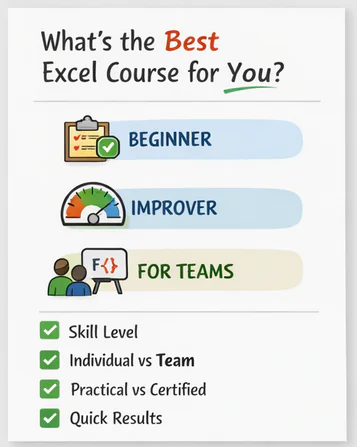
Best Excel Course In London (How To Actually Choose One!)
Search for “best Excel course in London” and you will get a dozen providers, all claiming to be the very best. In reality though, there isn’t just one best Excel course in London. When picking a course, you have to…
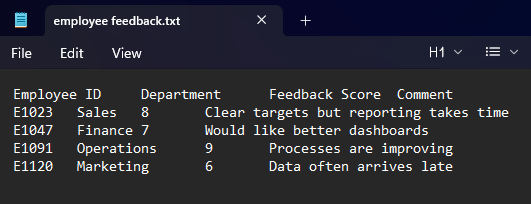
Excel’s New IMPORT Functions Explained – 2026
Microsoft just added some brand-new IMPORT functions, designed to make bringing external data into Excel easier! Instead of digging through menus or writing your own queries, you can now just use these new formulas, IMPORTTEXT and IMPORTCSV. Importing data is…

Power BI Courses – Buyers Guide 2026
So you want to go on a comprehensive Power BI course. Which one should you pick? Here’s a clear, numbered breakdown of six leading providers, all to help you make the right choice. To make this list, we reviewed dozens…

Acuity Training vs Happy – Best Excel Training Provider in 2025
This guide compares Acuity Training and Happy’s Excel courses in London, reviewing accreditation, trainer quality, course structure, pricing and support to help professionals choose the best provider for 2025. How To Choose A Training Provider For You Or Your Team…

A Buyers Guide To Excel Courses In London
London is a great city – especially for people looking to learn something new. Excel is no different, but there are so many great courses here! That’s why we made this breakdown of the best Excel courses in London, to…
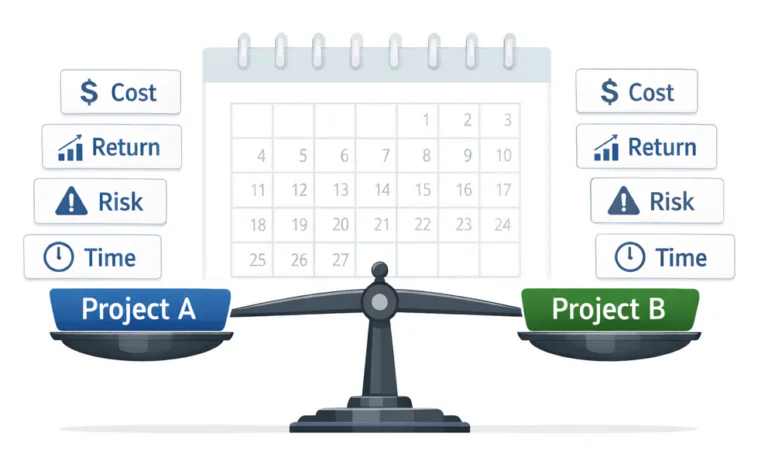
Building A Decision Model In Excel
We all know that Excel is an amazing tool to organise, calculate, analyse and visualise data. Experiences users know you can combine all these features to help make decisions! It can help you compare between different options, test assumptions you…
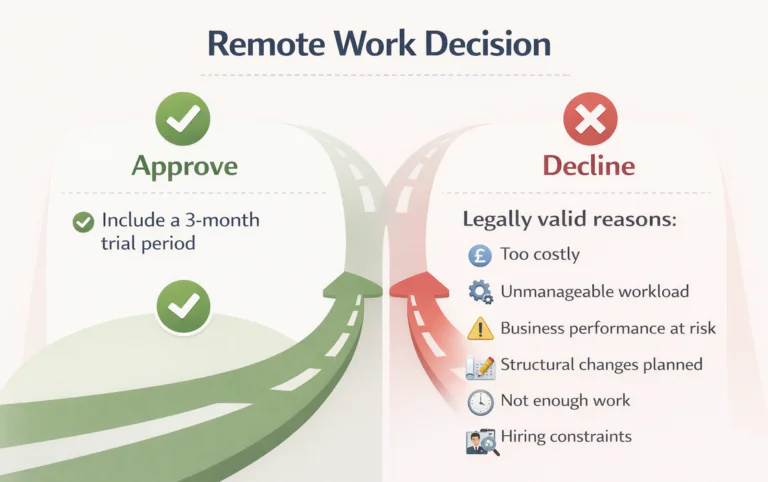
How to Handle Remote Working Requests (or Flexi Time)
Managing any team is usually challenging. Your role is to bring the best out of every team member, allowing them to be productive and happy. Doing that for multiple people is difficult. The larger the team, the harder it gets.…
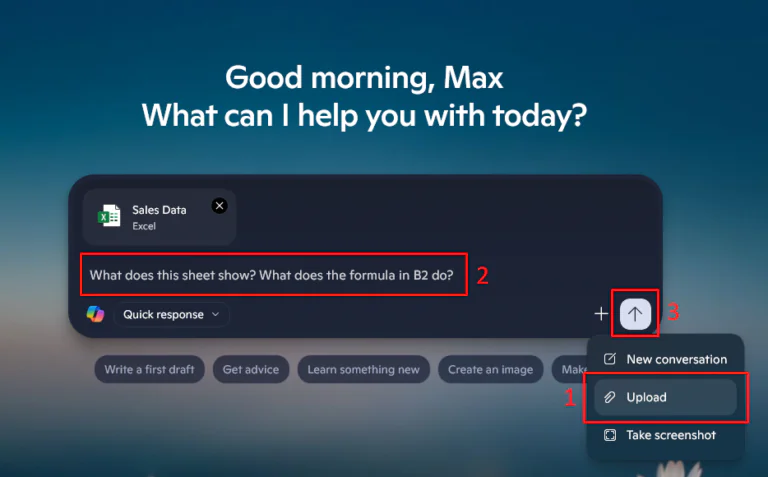
What Copilot Is And Isn’t For – For All Users
If you’ve seen Copilot but not sure what it is, or what to use it for – you aren’t alone! Copilot is now appearing on every Microsoft app, like Excel, Outlook, Word and Teams. Copilot is essentially a Microsoft specific…
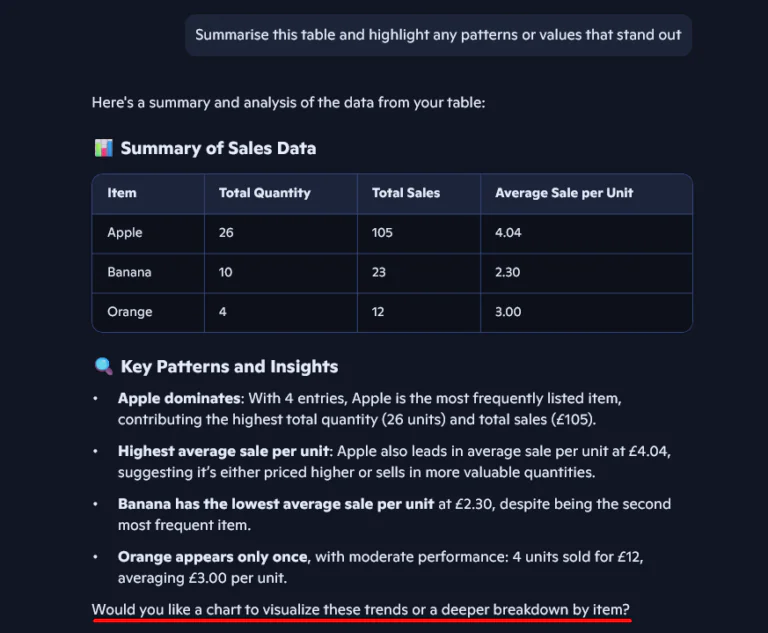
Copilot For Excel – Starter Guide
Microsoft Copilot is starting to become common with Excel users, everyone is talking about how much time you can save using it! But if you’re already a confident Excel user, is it really that useful? The short answer is: Copilot…

How To Use Copilot In Microsoft Outlook
Emails can cause a lot of stress and pressure. Your inbox is often full of disorganised messages, long threads, and digging through it all can be very time-consuming. Luckily for us, these days we have Microsoft Copilot to help! It’s…
- Facebook: https://www.facebook.com/profile.php?id=100066814899655
- X (Twitter): https://twitter.com/AcuityTraining
- LinkedIn: https://www.linkedin.com/company/acuity-training/