
News & Tips

Copilot vs ChatGPT – Which Should You Use at Work?
AI is an incredibly competitive market, with every tool trying to get your attention and business. Copilot vs ChatGPT, which is better, which should you use? But framing the argument like this misses the point and ends up making you…
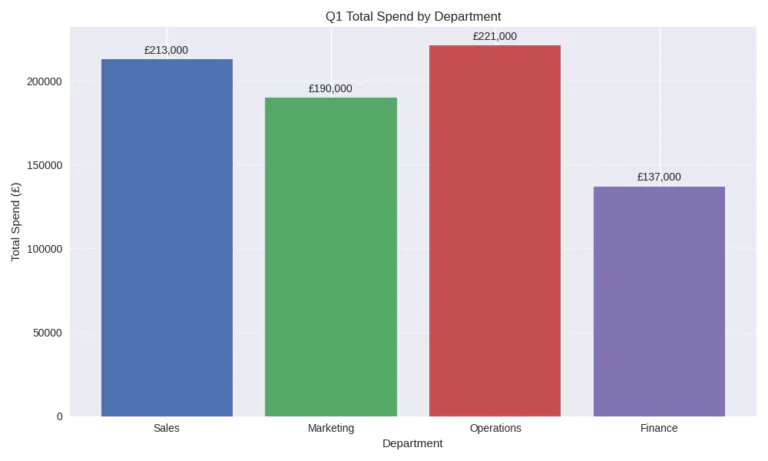
How Copilot Is Actually Used at Work: Finance
When you look at AI in the workplace, you often just get a list of impressive sounding features. Google Copilot for example, and you’ll see it can summarise documents, draft emails, analyse spreadsheets and generate reports. Sounds great, but what…

Acuity Training Wins the Feefo Platinum Award – 4 Years in a Row
We are extremely proud to share that the team at Acuity Training has once again been awarded the Feefo Platinum trusted service award! This marks our 4th consecutive year receiving the honours. The Platinum Award is only given to businesses…
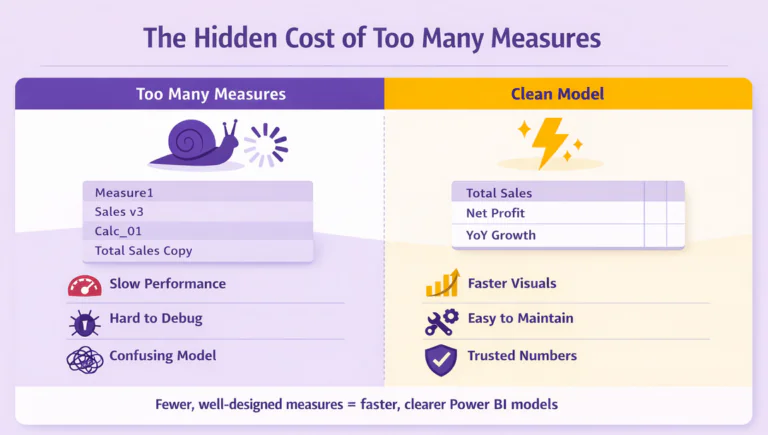
The Hidden Cost of Measures in Power BI
When you first start using Power BI, measures feel like magic. You type a quick SUM or CALCULATE, and your visual updates instantly. It’s exciting, until your model starts filling up with dozens, maybe hundreds, of measures. Before you know…
Handling Complex Logic Like a Pro in Excel – Helper Columns
When we think about Excel pros, what do we think of? Complicated spreadsheets and complex formulas. But in a professional environment, it’s often the complete opposite. The best spreadsheets rely on clear logic being broken down piece by piece. This…

Acuity Training’s London Office – New Location!
Big news! We are officially moving to a new office in London with more facilities for our attendees! It’s a much more central location, and just 1.5 miles away from our old office. We will be moving effective from the…
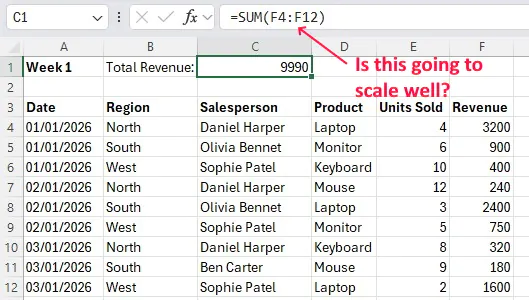
4 Overused Excel Bad Habits That Slow People Down
Whether it’s delegates, trainers, or consultants – I spend a lot of time with Excel users! And to be honest, I see a lot of the exact same habits cropping up again and again. They slow people down, make spreadsheets…

How to Use PIVOTBY in Excel (The New Way Of Reporting)
PivotTables are a classic, powerful tool in Excel. They are a great way to show you really understand Excel, and it’s more powerful tools. You can summarise and group data in just a few clicks, but they’re also a little…
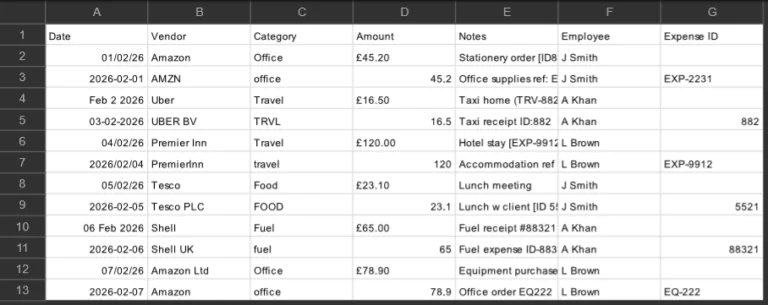
Building A Solid Data Cleaning Architecture: Guided Walkthrough
How does an Excel pro in 2026 turn messy data into a clean, reporting ready dataset? They design a complete, repeatable system. Modern Excel expertise isn’t just knowing formulas, it’s understanding how Excel works in the real world. Importing messy…

Excel’s New Functions Are Changing How We Work (2026 Guide)
Most of us learned Excel ages ago, and haven’t done much new since then – this goes for businesses and workers. For a very long time, most workplaces used Excel in more or less the same way. SUM formulas, VLOOKUPs,…

REGEXTEST: Checking Your Regex Works In Excel
Regex is one of the most powerful additions to modern Excel, but it has a real learning curve to it! Sometimes you’ll write what looks like the perfect patten, just to realise it isn’t doing what you expected. When you’re…
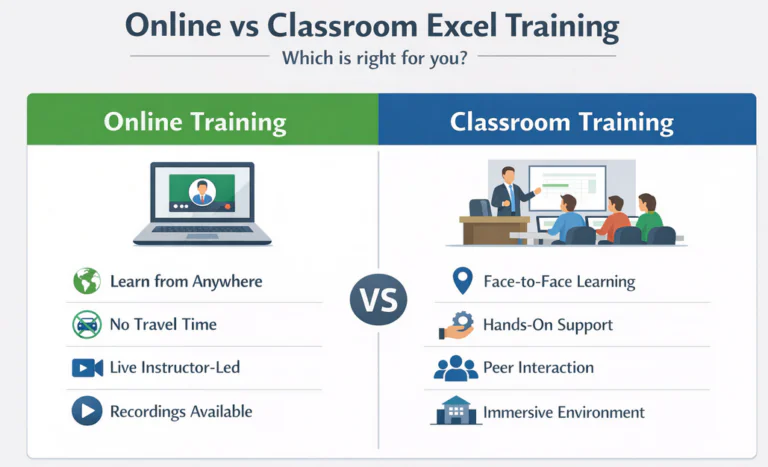
Online vs Classroom Excel Training – Which Format Should You Choose?
When it comes to improving your spreadsheet skills, the question isn’t just which course to take, but which format to learn in. Excel is at the centre of so many businesses, and selecting the right delivery will make a big…
- Facebook: https://www.facebook.com/profile.php?id=100066814899655
- X (Twitter): https://twitter.com/AcuityTraining
- LinkedIn: https://www.linkedin.com/company/acuity-training/