
Microsoft Power BI
Our Power BI articles below clearly and simply how to use specific aspects of Microsoft Power BI that we also cover in our Power BI training courses.
AllAdobe InDesignAdobe PhotoshopManagementMicrosoft ExcelMicrosoft Power AutomateMicrosoft Power BIMicrosoft PowerPointMicrosoft ProjectMicrosoft SharePointMicrosoft WordPublic SpeakingSQLTime Management
Linking Power BI & SQL Server [Ultimate Guide]
Power BI supports a variety of data sources such as Blank Queries, Flat Files, SQL Server Database, OData Feed, Azure Cloud Platform etc. The number of import features you have will depend on the version of Power BI that you…

A Detailed Comparison Of Power BI And SSRS
This article looks at the main differences between the Microsoft SSRS (SQL Server Reporting Services) and the Microsoft Power BI (Microsoft Power Business Intelligence). We compare the two Microsoft business intelligence tools against a number of criteria and then look…
[Introduction] Power BI & DAX
DAX is a formula expression language used in Power BI, Power Pivot and Excel. In simpler terms: It’s the language that Power BI speaks, you need to know it to get the most out of your data. To become an…
16 QUESTIONS You Will Get In A Power BI Interview!
Power BI is a data analysis and visualisation tool developed by Microsoft. Currently, it is one of the most sought-after skills for business intelligence analysts in particular and data scientists in general. This article covers some of the most common…
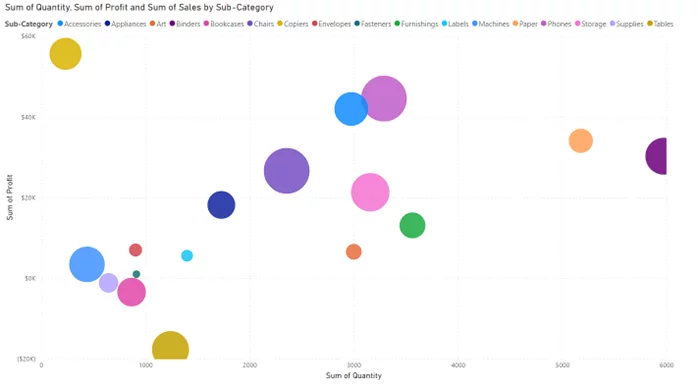
Learn To Make Bubble Charts [Power BI Visuals!]
Power BI is a powerful and versatile data visualisation tool, developed by Microsoft, that has revolutionised the way organisations make data-driven decisions. This intuitive and user-friendly platform enables users to connect to various data sources, transform raw data into insightful…
Using The Key Influencer Visual [Power BI Visuals!]
In this article, we look at creating a Key Influencer visual in Microsoft Power BI. We will see what a key influencer visual is, when it is valuable and look at its limitations. Our online Microsoft Power BI training courses…
Power BI: Quick Guide To Customising Themes In Power BI
Using Power BI Desktop themes, you can apply design changes to your entire report. This can include using corporate colours, and changing the default font size. This is one of the great features that you learn as you discover how…