
Summarise Data With The Group By Feature [3 Minutes Or Less!]
The Group By feature in Power BI summarises data based on one or more aggregate functions.
You can use the Group By feature to find the average, count, min, max, or any other aggregate value for one column, based on unique values in other columns.
In thie article you will learn how to use the Group By feature on multiple columns and with multiple aggregate functions.
We cover the Group By feature during our Microsoft Power BI courses if you would like to learn more.
A Simple Example Of The Group By Feature
Let’s look at a simple example.
The CSV file for the dataset you will be using in this article is available at the following link.
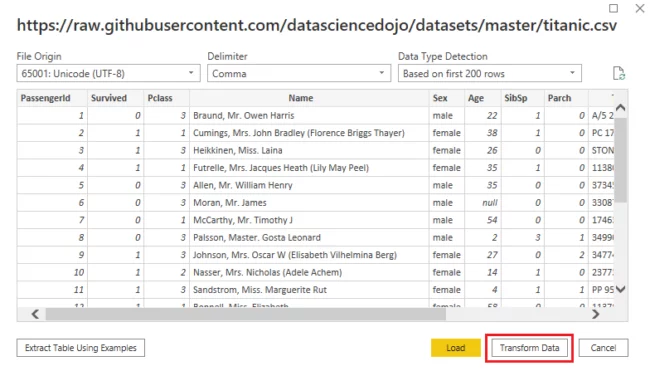
https://raw.githubusercontent.com/datasciencedojo/datasets/master/titanic.csv
Import the CSV file from your local file system or directly via the online link into Power BI Desktop.
The Power BI Group By feature is available in the Power Query editor.
You have two ways to load your dataset into the Power Query editor.
1) When importing the data, you will see the following window.
If you click the Transform Data button, the Power Query editor will open.
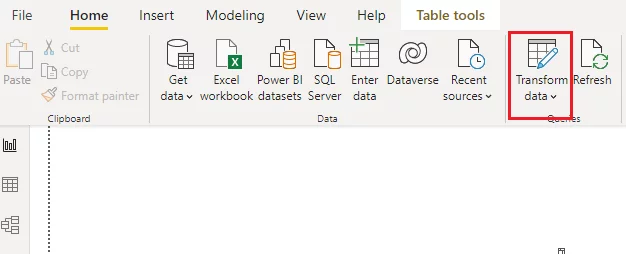
2) If you have already imported your data into the reports view by clicking the Load button, you can still open the Power Query editor.
Click the Transform data option in the ribbon, as shown below.
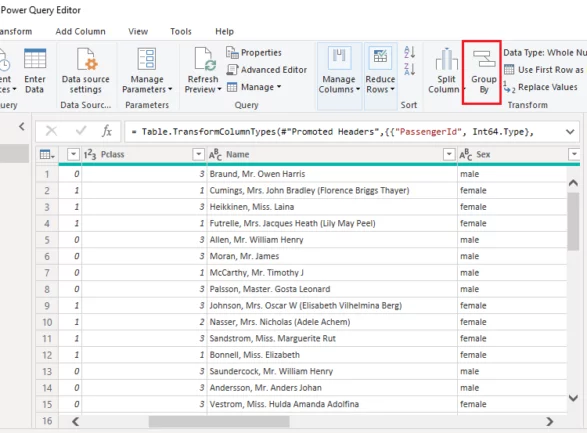
You will see the window below when the Power Query editor opens.
Click the Group By option in the ribbon.
And now the Group By window will open.
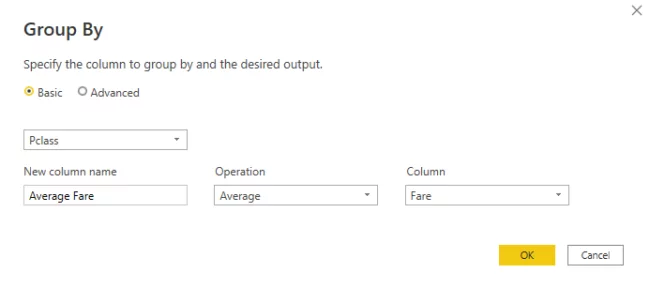
To apply the Group By feature using a single column and a single aggregate function, select the radio button for the Basic option as shown.
As our first example, let’s find the average fare paid by the passengers from the different passenger classes.
In other words, let’s group the average fares in the Titanic dataset by passenger classes.
You need to select a minimum of three options to apply the Group By feature:
1) First, you need to select the column you want to use to group the data. Also called your aggregation column.
In our example, this is the Pclass (passenger class) column.
2) Then, you need to select a name for the new column created. Enter the name for this column in the New column name box.
3) Now, you need to choose the aggregate function used to group values. You do this in the Operation drop-down list.
You can select functions like count, min, max, median, etc., as the aggregate function.
In our example, the Operation field specifies the Average aggregate function.
4) Finally, you need to select the column that contains the data that will be grouped. The box you enter this into is called Column. We have chosen the Fare column.
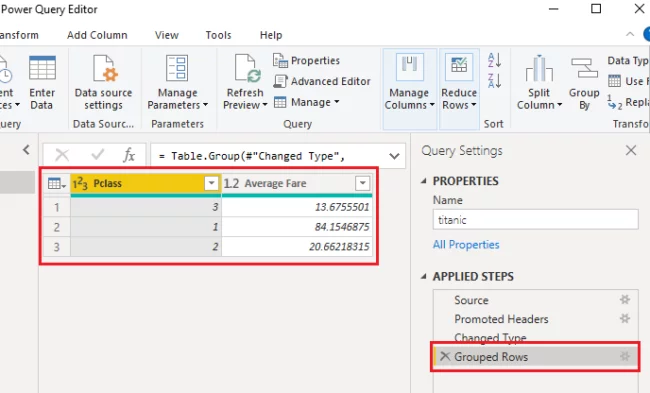
In the output, you can see two new columns.
The first column contains the passenger classes (e.g. 1, 2, and 3), and the second column contains the average fare paid by passengers in that class.
The name of the Average Fare column is as you specified in the previous step. You can give any name to this column.
Using Group By On Multiple Columns
You can also use group by to group data using multiple columns.
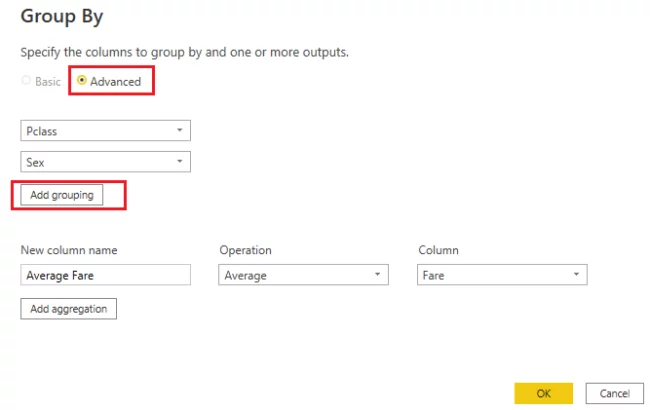
Select the Advanced option in the Group By window.
Let’s group average fares by the Pclass (passenger class) and Sex columns.
By default, you can select one column to use in the Group By feature.
To add more columns, you need to click the Add grouping button.
All the other options are as they were in the previous section.
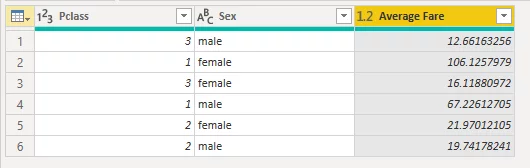
You can now see three columns in the output table (below).
The unique values in the Pclass column are repeated for each of the unique values in the Sex column.
You can see that the average fare paid by the male passengers travelling in the first class was 67.22. On the other hand, the female passengers from the first-class paid an average fare of 106.12.
Group By with Multiple Aggregation Functions
You can also group data using multiple aggregate functions.
To do so, click the Add aggregation button in the Group By window.
This adds another row of input boxes to enter the relevant data.
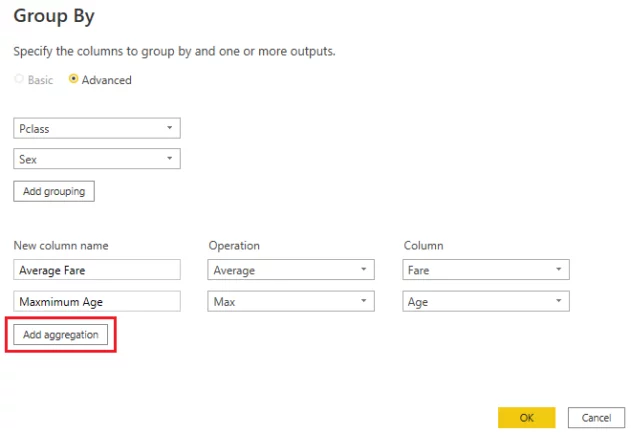
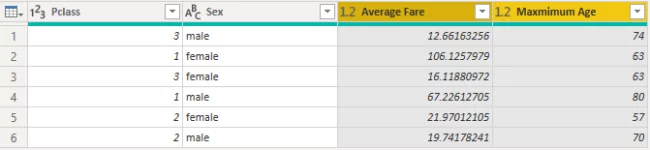
The Group By feature in the above example uses two aggregate functions.
- The first aggregate function groups the average fare by the “PClass” and “Sex” columns.
- The second aggregate function groups the maximum age by the “PClass” and “Sex” columns.
The output is a table that summarises the data. All the rows of data in the original table have generated valuable, actionable data.
You can easily see the average fares paid by the different genders in the various classes on the Titanic.
You can also see the maximum age of the passengers in each of those groupings.
Conclusion
The Power BI Group By feature is powerful for grouping data.
In this article, you saw how to use the Power BI Group By feature via the Power Query editor GUI options.
You can also use the GroupBy function in DAX to gain more fine-grained control over the Power BI Group By feature.
Articles On Power BI Visuals


- Facebook: https://www.facebook.com/profile.php?id=100066814899655
- X (Twitter): https://twitter.com/AcuityTraining
- LinkedIn: https://www.linkedin.com/company/acuity-training/