
News & Tips
AllAdobe InDesignManagementMicrosoft CopilotMicrosoft ExcelMicrosoft Power AutomateMicrosoft Power BIMicrosoft PowerPointMicrosoft ProjectMicrosoft SharePointMicrosoft WordNewsPresentation SkillsSQLTime Management
Excel’s IMAGE Function: Put Pictures Directly Into Your Cells
Managing a spreadsheet with product images, staff photos, or visual data has always been awkward. You insert a picture, it floats over the cells, refuses to stay where you put it, and the moment anyone resizes a column the whole…
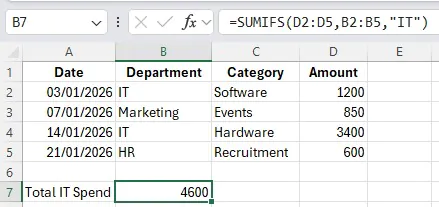
SUMIFS for Budget Reporting: Build A Summary Dashboard Without Pivot Tables
We run Excel workshops in London every month, so we get to spot a lot of trends on how users use Excel at their jobs. There are countless project managers and finance assistants all over the UK building summary dashboards,…
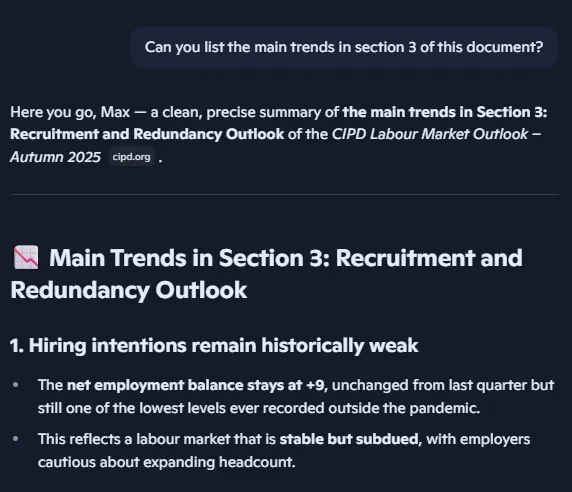
Copilot In Microsoft Edge – Research Workflows
Most people know Copilot as the amazing assistant inside Excel or Teams. What far fewer people use (or even know exists!) is Copilot built directly into the Edge browser itself. For anyone whose job involves researching information, reading reports, comparing…
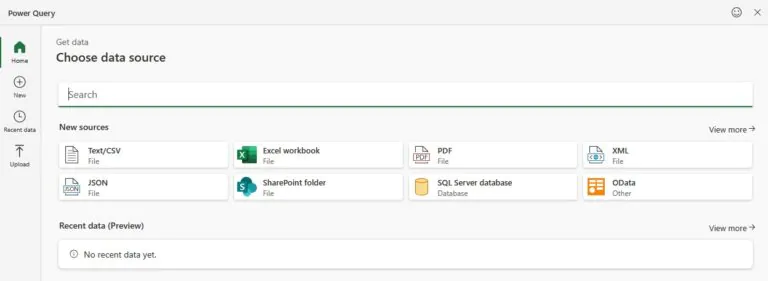
Power Query in Excel for the Web: What’s Changed
For years, Power Query was one of the main reasons Excel users couldn’t fully move their work to their browsers. You could view query results in Excel for the web, but if you needed to actually build or edit a…
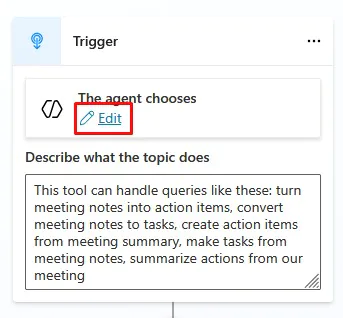
Copilot Studio – Building A Useful Meeting Agent
If you’ve been playing around with Copilot in Excel, Outlook, or Teams – you’ll know this: It’s incredible at drafting and summarising… But it doesn’t always do something practical. Copilot Studio and agents is where that all changes. Instead of…
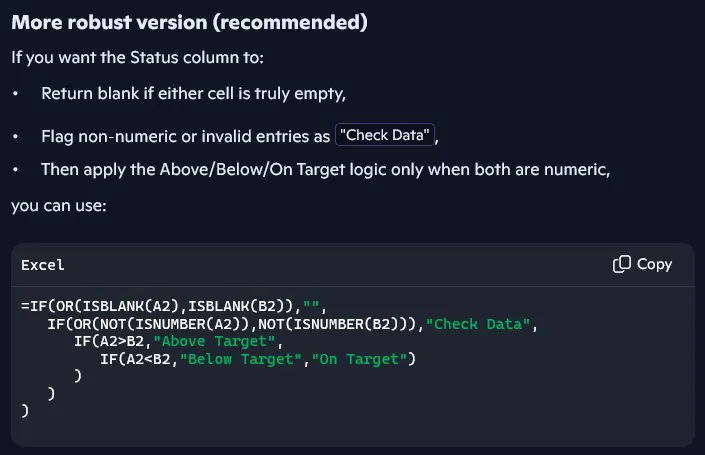
Using Copilot To Generate Formulas In Excel
Writing formulas is one of the most useful – but also the most frustrating – parts of working with data. Even when you know exactly what you need to calculate, it still takes time and knowledge to: Build the logic…

Input Slicer in Power BI – Filter Long Lists Fast!
Filtering large lists in Power BI should not feel like scrolling endlessly through hundreds of dropdown values. The Power BI input slicer makes filtering faster and smarter by allowing users to type or paste values directly into a slicer. Instead…

Power BI Filter Context – How Measures Really Evaluate
Filter context is one of the most important and most misunderstood concepts in Power BI. It is also the reason a single measure can return different values depending on where it appears in a report. This article is written for…
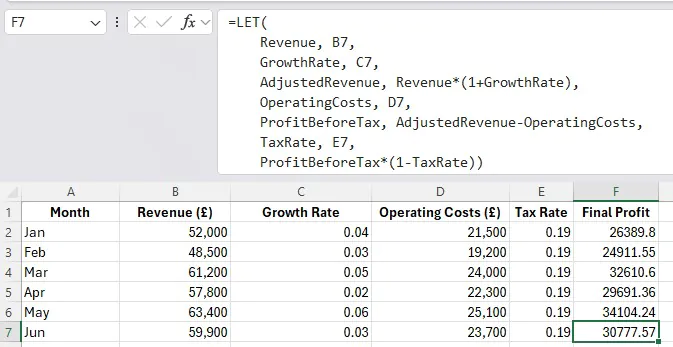
Excel’s LET Function: The Secret Juice In Excel
Excel formulas can get complicated quickly. A simple calculation can quickly turn into multiple steps, and pretty soon you’ll be repeating the same logic again and again to get a final result. The LET function allows you to assign names…

Copilot vs ChatGPT – Which Should You Use at Work?
AI is an incredibly competitive market, with every tool trying to get your attention and business. Copilot vs ChatGPT, which is better, which should you use? But framing the argument like this misses the point and ends up making you…
How Copilot Is Actually Used at Work: Finance
When you look at AI in the workplace, you often just get a list of impressive sounding features. Google Copilot for example, and you’ll see it can summarise documents, draft emails, analyse spreadsheets and generate reports. Sounds great, but what…

Acuity Training Wins the Feefo Platinum Award – 4 Years in a Row
We are extremely proud to share that the team at Acuity Training has once again been awarded the Feefo Platinum trusted service award! This marks our 4th consecutive year receiving the honours. The Platinum Award is only given to businesses…
- Facebook: https://www.facebook.com/profile.php?id=100066814899655
- X (Twitter): https://twitter.com/AcuityTraining
- LinkedIn: https://www.linkedin.com/company/acuity-training/