
Learn Project Views [Quick And Simple!]
Deadlines, resources, dependencies… It can all become overwhelming pretty quickly!
That’s where Microsoft Project comes in.
With its powerful project management tools, it’s a go-to choice for professionals across a wide range of industries.
And one of the key features that makes it so versatile is its views.
In this article, we’ll explore some of the most important views and show you how to get the most out of them.
This is also covered in our classroom courses.
What Is A Project View?
At its core, a project view is simply a way of looking at your project data. Think of it as a lens that helps you focus on specific aspects of your project, whether it’s tasks, resources, or timelines.
In Microsoft Project, you can choose from a wide range of pre-built views, each of which is designed to help you visualize and manage your project in a particular way.
Not sure if Project is the software for your needs? Check out our Project Pros and Cons guide here!
For example, the Gantt chart view is a popular choice for tracking task progress over time, while the resource usage view can help you manage your team’s workload.
But perhaps the most powerful aspect of project views is the ability to customize them to your specific needs.
With a few clicks, you can add or remove columns, apply filters, and adjust formatting to create a view that gives you exactly the information you need to stay on top of your project.
So, why bother with project views? Well, simply put, they can make your life a whole lot easier.
By providing a clear, visual representation of your project data, they help you stay organized and focused on your goals.
Instead of sifting through endless spreadsheets or lists, you can quickly get a sense of where things stand and what needs to be done.
And because you can customize views to your specific needs, you can get a level of detail and granularity that would be impossible to achieve otherwise.
For example, you can create a view that shows you only the critical path tasks or one that highlights any overdue tasks that require your attention.
Ultimately, mastering project views can save you time, reduce stress, and help you deliver your projects on time and on budget.

Different Views – Which To Pick?
Before we go into details on using each different kind of view: check out this overview on when they are each best to use!
Grid View Use Cases:
A great time to use the grid view is when you need to get a bird’s-eye view of my project data. For example, when in the planning phase of a project, using a grid view to create a comprehensive task list and assign resources to each task.
Then, as the project progresses, you can use a grid view to monitor task status, track costs, and make adjustments as needed.
Overall, if you need to manage project data in a flexible and customizable way, a grid view is a great choice.
Board View Use Cases:
The board view is one of my go-to views when we need a visual representation of my project tasks. It’s especially useful when working on projects with multiple phases or stages and you need to track the progress of each task.
In the board view, each task is represented by a card, and you can move the cards between columns to indicate their status.
For example, you might have columns for “To Do,” “In Progress,” and “Done.” The board view is great because it’s easy to see which tasks are on track and which tasks need attention.
Plus, because it’s such a visual view, it’s great for sharing project progress with stakeholders who might not be as familiar with project management concepts. Overall, if you need a simple and intuitive way to track task progress, a board view is a great option.
Timeline View Use Cases:
The timeline view is one of the best views when you need to create a visual representation of my project schedule. It’s especially useful when you need to communicate project timelines to stakeholders or team members.
In the timeline view, you can see your project tasks laid out along a horizontal timeline, with each task represented by a bar. You can adjust the start and end dates of each task by dragging the bars, and you can also link tasks together to create dependencies.
It’s so effective because it gives a clear sense of how a project is progressing and where potential delays might occur.
Plus, because it’s such a visual view, it’s easy to spot scheduling conflicts or gaps in the project timeline. Overall, if you need to create a project schedule that’s easy to understand and communicate, a timeline view is a great choice.
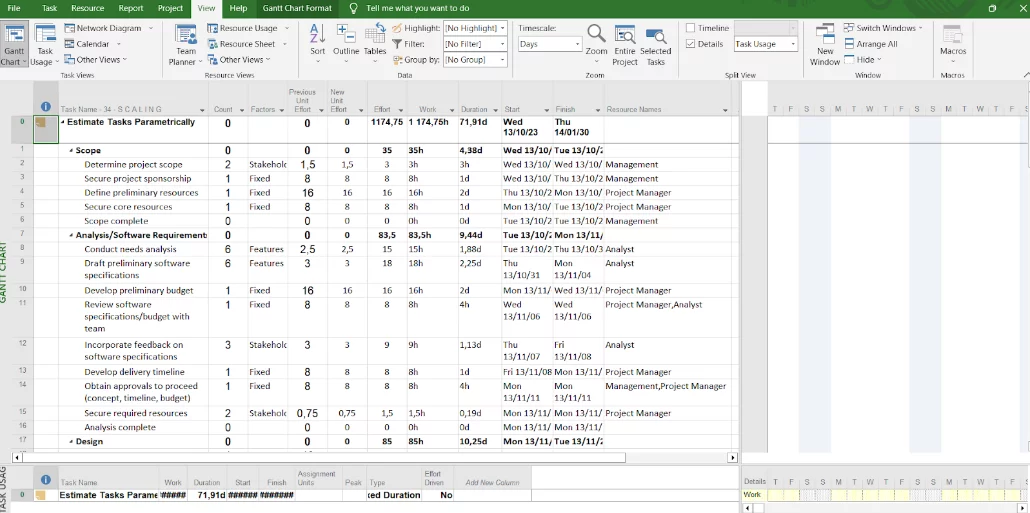
Grid View – Explained
Grid view is one of the most basic views in Microsoft Project, but that doesn’t mean it’s not powerful. At its core, it’s a simple table that displays your project data in rows and columns.
Each row represents a task or resource, and each column represents a different aspect of that task or resource, such as the start date, end date, duration, or cost.
For more on using dates in project, check out our guide to project schedules here!
You can customize the columns to show exactly the information you need, and you can sort and filter the rows to focus on specific subsets of data. So why would you use grid view? Well, for starters, it’s a great way to get a high-level overview of your project.
You can see all your tasks and resources in one place and quickly get a sense of how they’re interconnected.
And because it’s so customizable, you can drill down into the details as much as you need to.
For example, you can add custom columns to track specific data points that are important to your project or apply filters to show only the tasks that are behind schedule.
In short, grid view is a flexible and versatile tool that can help you stay on top of your project data and make informed decisions.
Grid View – How To Use
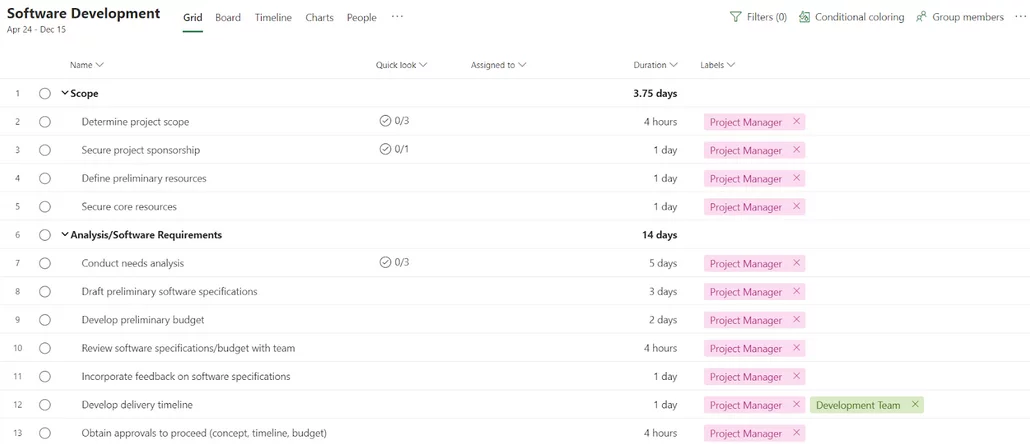
Your grid view will look like the screenshot above. You will see the different kinds of views at the top next to your project name.
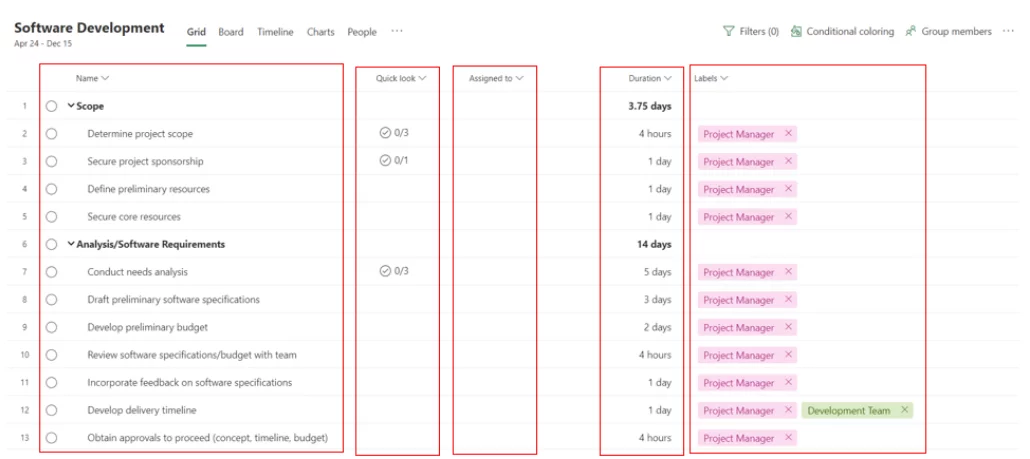
Your grid view will show you a total of 5 different columns:
-
- Name
- Quick Look
- Assigned To
- Duration
- Labels
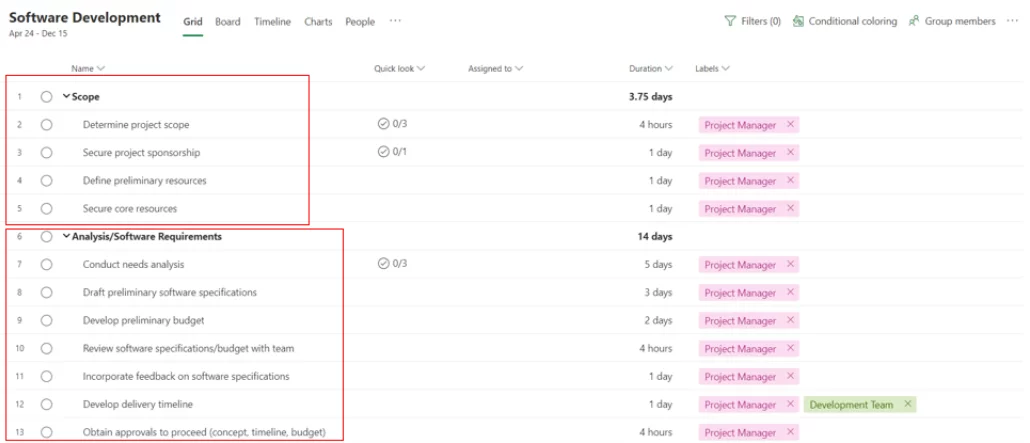
You can also see your row headings and subheadings in the grid view:
-
- Scope
- Analysis/Software Requirements
- Design
- Development
- Testing
- Uni Testing
- Integration Testing
- Training
- Documentation
- Pilot
- Deployment
- Post Implementation Review
Board View – Explained
If you’re a fan of Kanban boards, you’ll love Microsoft Project’s board view. It’s a visual, card-based view that lets you track your project tasks in a highly intuitive way.
Each task is represented by a card, which you can move between columns to indicate its status (e.g., To Do, In Progress, Done).
You can customize the columns to match your workflow, and you can drag and drop cards to quickly update their status.
So why would you use board view?
Well, if you’re working on a project with lots of tasks that are in different stages of completion, board view can be a great way to get a quick snapshot of where things stand.
Sometimes the different streams of a project can get messy! Check out our guide to critical path analysis here for a breakdown on how to streamline the process!
You can see at a glance which tasks are done, which are in progress, and which are still waiting to be started. And because it’s so visual, it can be a great tool for communicating progress to stakeholders who may not be as familiar with project management jargon.
Finally, because it’s so flexible, you can use board view in combination with other views to get a well-rounded understanding of your project.
For example, you might use a grid view to track your project costs and a board view to track task progress. Overall, board view is a versatile and user-friendly tool that can help you manage your project tasks more effectively.
Board View – How To Use
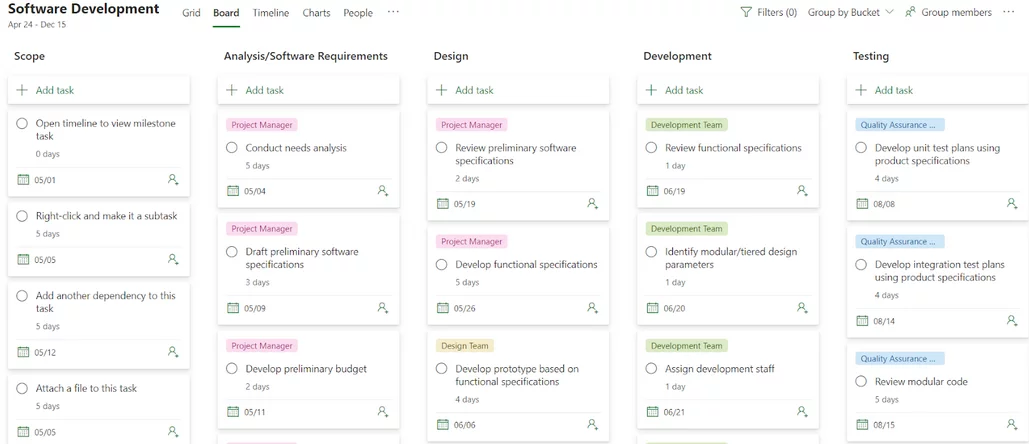
Your board view is very simple. It will contain all of the different stages of the project.
The rows in the grid view are now the columns in the board view.
You will then have each subheading under the column heading with the deadline and team members!
Timeline View – Explained
When you need to create a visual representation of my project schedule, the timeline view is my go-to choice. In the timeline view, you can see all of your project tasks laid out along a horizontal timeline, with each task represented by a bar.
You can adjust the start and end dates of each task by dragging the bars, and you can also link tasks together to create dependencies.
Talking about start and end dates, if you would like to learn how to create a planner in Microsoft Project, we explain everything in this article.
I find this view especially helpful for identifying potential scheduling conflicts or gaps in the project timeline.
You can also use our guide here to find out how you can add risk to a project!
Because the timeline view is so visual, it’s easy to communicate project timelines to stakeholders or team members who might not be as familiar with project management concepts.
Overall, if you want to create a project schedule that’s easy to understand and communicate, a timeline view is an excellent option.
Additionally, if you need to make changes to the schedule, you can simply drag and drop tasks to adjust their timing or duration. In my experience, mastering the timeline view is an essential skill for anyone who wants to be a proficient project manager.
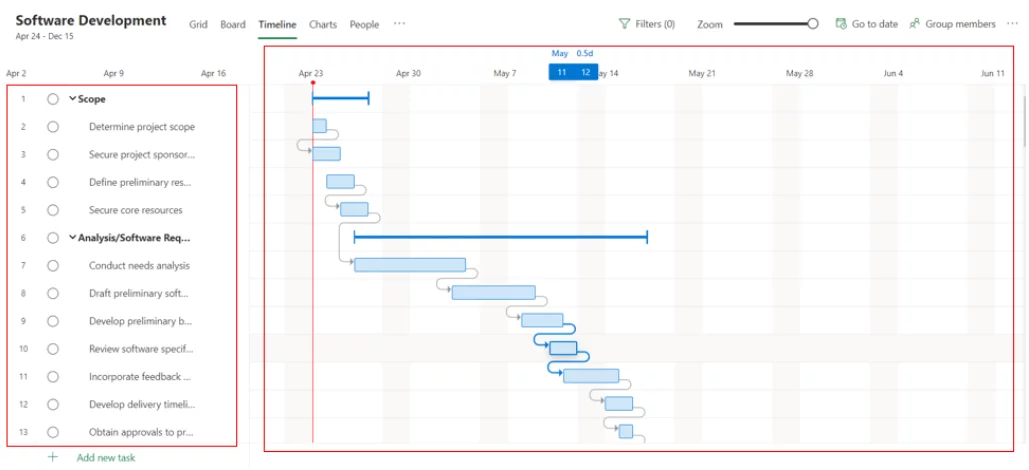
Timeline View – How To Use
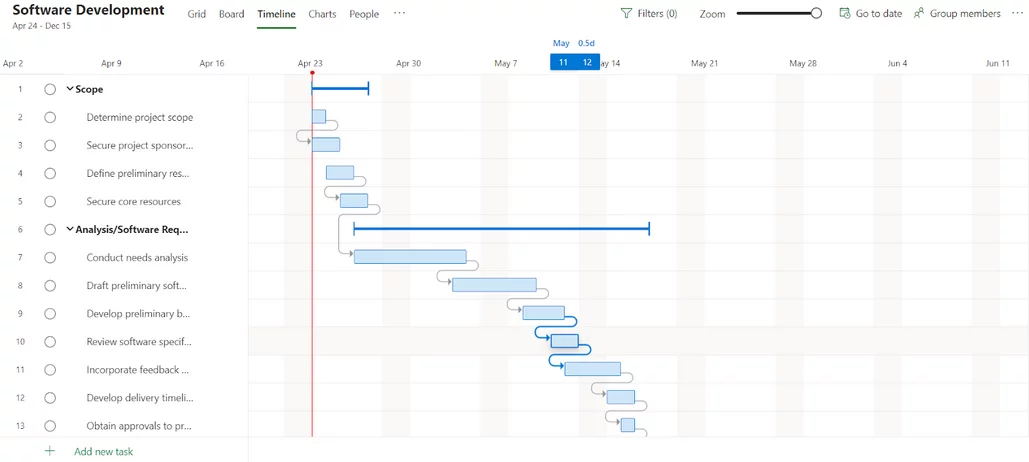
Your timeline view looks similar to the grid view.
The stages of the project are displayed on the left-hand side in a column with all of the subheadings next to it.
However, the deadlines are displayed on the right-hand side in a chart where you can see exactly when it has to be done.
Conclusion
By understanding how grid view, board view, and timeline view work, you are now able to approach project management from multiple perspectives and select the view that best fits my needs in any given situation.
Whether working on a personal project or managing a team of professionals, these skills will be invaluable. Managing projects more efficiently and effectively will ultimately helps you to achieve your goals and succeed in your career.
Whether you’re a casual project user or a professional project manager, mastering Microsoft Project views is an excellent way to enhance your project management skills and achieve better results.
Looking for a more technical guide on project? Take a look at our deep dive into Project’s File Extensions here!

- Facebook: https://www.facebook.com/profile.php?id=100066814899655
- X (Twitter): https://twitter.com/AcuityTraining
- LinkedIn: https://www.linkedin.com/company/acuity-training/