
What Is A PERT Chart & How To Use Them!

Mapping out a big project can be a huge challenge.
With so many details to work out and schedules to work around…
You need a PERT Chart!
They visually represent a project’s task, dependencies and estimated time.
PERT Chart In 5 Steps
There are five steps to creating a PERT chart.
1. Identify All Tasks
As with all project management, the first step is identifying exactly what you would like to achieve.
In this case, you break it down into the largest piece of an area of a project that can be completed start to finish without requiring any input from another part of the project.
2. Identify All Dependencies
This is where things get complicated.
You need to identify for each task what the precedent tasks are that need to be completed before this task can be started.

3. Create Time Constraints For Each Task
Experienced project managers will have multiple ways of looking at this.
A simple method to estimate this is the PERT formula.
This is represented at ( O + (4M) +P ) / 6 = Expected duration.
O is the optimistic timeline, M the most likely timeline, and P is the pessimistic timeline.
For example, if O is 2 days, M is 3 days and P is 6 days. This would give a project length of 3 ⅓ days.
4. Draw Nodes, Arrows And Time Comments.
Each individual task needs it’s own node in a PERT chart.
From here, draw an arrow to the next node based on the dependency. and along the arrow write the time constrant you worked out.
5. Add All The Nodes And Connect Them Up!
Let’s look at the simplest possible case, a single activity.
To represent it, we would have a single arrow running from node 1 to node 2.
On the arrow, we would put the activity and how long it would take.
For example, ‘Collect project data: 3 days”.
On the nodes we would put the date, so for example on node 1 we could put 5 January and on node 2 we would put 8 January.
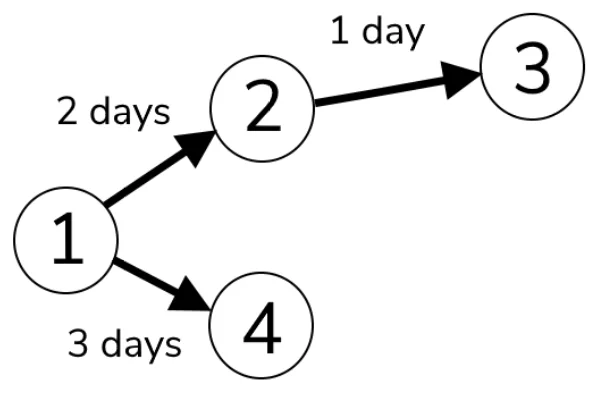
Let’s expand this by looking at an example with multiple activities.
In the diagram, the circles are milestone dates.
This makes it very easy to see that the activities will only reach milestones 3 and 6 once milestone 2 is completed.
You can also see that milestone 6 requires input that initiates when milestones 4 and 5 are completed, and that milestone 5 is dependent on milestone 4.
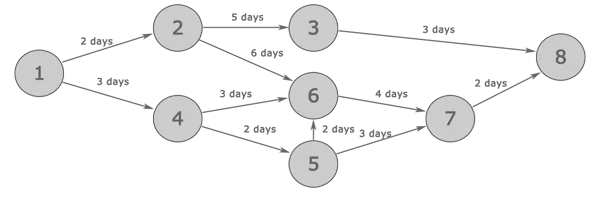
This would be very complex to represent in a table or on most other project management charts.
Background
Standing for Project Evaluation Review Techniques, the PERT chart was created by the US Navy in the 1950s to manage the Polaris Submarine Missile project.
At the same time, the private sector developed a similar technique called the critical path, which is also well-known in project management.
Both methods are very similar and focus on the essential items that will delay the project from reaching completion.
When To Use A PERT Chart?
The PERT charts are helpful throughout the lifecycle of a project.
Their ability to identify critical paths for projects means that they are very useful in the following circumstances:
1. When planning a project, to determine how long it will take.
2. When trying to understand which tasks can be completed in series and which in parallel.
3. When a project is facing delays, they allow you to quickly identify where delays will cause issues later in the project.
When dealing with a smaller project, Microsoft Planner can be of help.
Final Thoughts
PERT charts are part of a project manager’s toolkit.
They can’t be used to solve every problem on a project, but if you are looking at issues relating to a project’s critical path and key dependencies, they are very useful.
If you often deal with complex projects, you can make your life easier by using Ms Project to manage all the aspects of your project. Check out our project training courses for more information.

- Facebook: https://www.facebook.com/profile.php?id=100066814899655
- X (Twitter): https://twitter.com/AcuityTraining
- LinkedIn: https://www.linkedin.com/company/acuity-training/