
Microsoft Power BI
Our Power BI articles below clearly and simply how to use specific aspects of Microsoft Power BI that we also cover in our Power BI training courses.
AllAdobe InDesignAdobe PhotoshopManagementMicrosoft ExcelMicrosoft Power AutomateMicrosoft Power BIMicrosoft PowerPointMicrosoft ProjectMicrosoft SharePointMicrosoft WordPresentation SkillsSQLTime Management
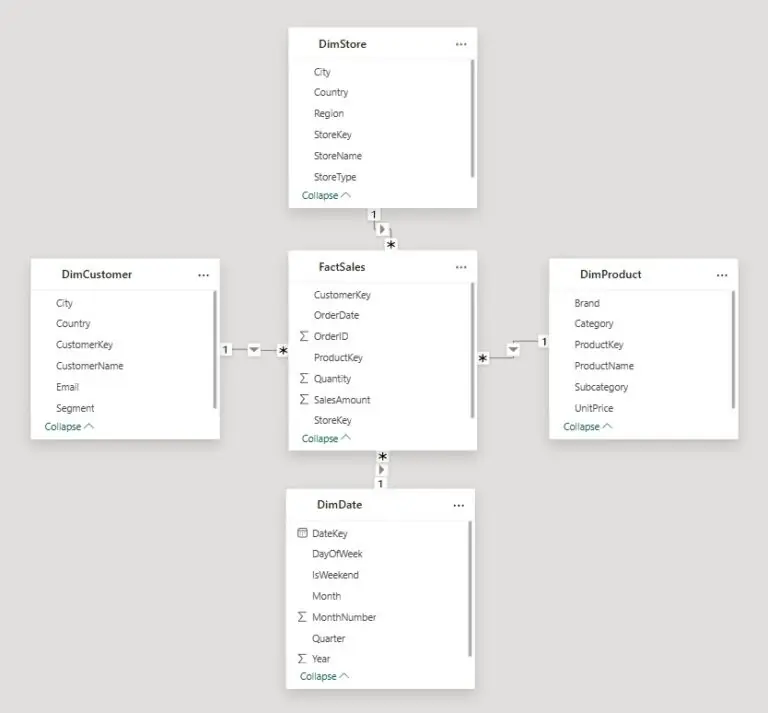
Star Schema vs Snowflake Schema in Power BI: Which Should You Use?
When you start building Power BI reports, it’s tempting to jump straight into visuals. But very quickly, you realise that slow refreshes, confusing relationships, and unpredictable DAX usually point to one thing: the data model. Good modelling is the foundation…

The Best Ways To Learn Power BI
Power BI is one of the most powerful tools for transforming raw data into interactive, insightful dashboards and reports. As more businesses seek data-driven decision-making, mastering Power BI has become an essential skill for analysts, business intelligence professionals, and even…
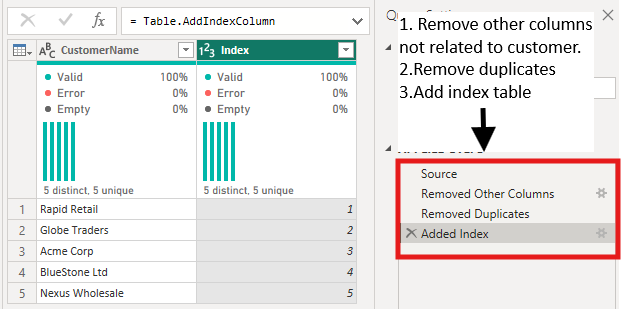
The 10 Star Schema Mistakes Everyone Makes
Ever had problems with your DAX that just don’t make sense? Sometimes the culprit isn’t actually your DAX, it’s your data model. Star schema mistakes are incredibly common in Power BI, and really hard to track down. When your data model…

Power BI Measures vs Calculated Columns: What’s the Difference?
Both measures and calculated columns perform calculations, so why does Power BI have two options? They may look alike, but they work in different parts of the engine and serve different purposes. Understanding this difference early helps you design reports…

Decoding DAX Query Plans: How to Detect and Fix Query Bottlenecks
Every Power BI developer knows the feeling. Your report looks great, but once people start clicking around, it slows down. Charts take forever to load, and you’re left wondering what’s wrong. The problem isn’t just that it’s slow. It’s that…
Power BI for London Project Managers: Visualising Costs, Risks, and Timelines
London never stops building, from new transport links to borough-wide refurbishments. But with so many moving parts, keeping track of costs, risks, and timelines is never simple. That’s where Power BI steps in. It pulls scattered project data into clear,…
How London Teams Use Power BI to Drive Hybrid Work Decisions
Hybrid work has become the new normal in London. But with office space in the city costing around £140+ per square foot each year, businesses are facing tough questions. Which offices sit half-empty most of the week? Are people actually…

Power BI Statistics You Need To See (2025)
Power BI continues to dominate the analytics and business intelligence market. From small businesses, to the biggest conglomerates in the world – Power BI is the go-to software. As a Power BI training company, it’s important we stay on top…
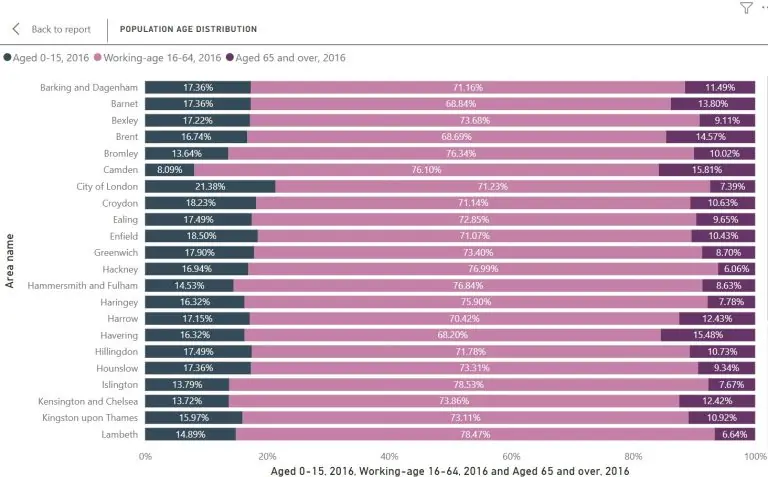
Building a London Borough Demographics Dashboard in Power BI
Demographic data plays a key role in understanding how a city like London functions. Whether you’re working in local government, HR, or marketing, knowing how population patterns differ between boroughs helps support smarter decisions. In this guide, you’ll learn how…

Power BI Training for Contractors: Flexible & Efficient Learning Paths
Contractors today work in complex, data-driven environments. Whether you’re managing construction projects, engineering timelines, or subcontractor costs, Microsoft Power BI gives you the ability to transform raw data into actionable insights. But learning Power BI effectively – and in a…

Improving Your Power BI Rollout: A Complete Guide
Rolling out Microsoft Power BI is more than a software deployment. It’s a business transformation initiative that requires aligning people, processes, and technology. Successful adoption depends on three pillars: governance, adoption, and measurement. Organisations that underinvest in training or governance…
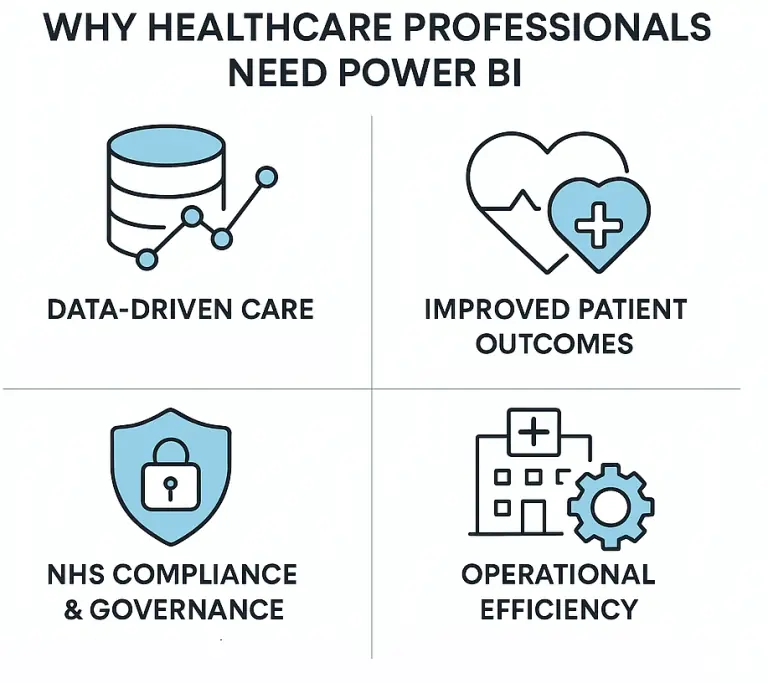
Power BI Training for Healthcare Professionals in London
Healthcare professionals in London are under more pressure than ever to make decisions based on data. From monitoring patient outcomes to optimising hospital resources, Microsoft Power BI has become a vital tool in the NHS and wider healthcare sector. This…
- Facebook: https://www.facebook.com/profile.php?id=100066814899655
- X (Twitter): https://twitter.com/AcuityTraining
- LinkedIn: https://www.linkedin.com/company/acuity-training/