
AVERAGE Function Excel – Quick Guide!
Contents
The AVERAGE function in Excel calculates the mean value of a group of numbers, balancing out the extremes.
It’s like finding the middle ground in a set of data points.
Excel Function Details:
| Available in: | All versions of Microsoft Excel |
| User Level: | Beginners |
| Inputs: | “Number1”: The initial number or range for averaging. |
| “Number2, …”: Additional numbers or ranges, if any. | |
| Output: | Computes the mean of the numbers. |
| Wildcards: | Not supported by AVERAGE. |
| Case Sensitive: | Not case-sensitive. |
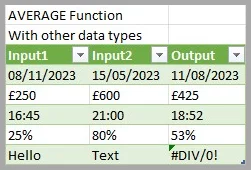
If your data isn’t formatted perfectly, the function will not work as intended. A great tip is to use the TRIM Function to clean your data to avoid this.
Advanced Example
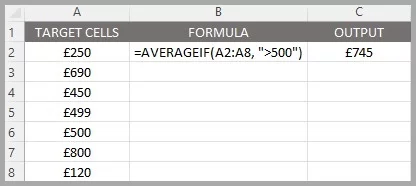
Let’s say you have a list of weekly sales figures for the quarter and want to find the average sales for weeks with sales over £500 to focus on high-performing weeks.
Your sales data is in cells B1 through B12. In cell C1, enter the formula
=AVERAGEIF(A2:A8, “>500”)
This formula will calculate the average sales for all weeks where the sales figure is greater than £500, giving you insight into your best sales weeks!
The AVERAGE function can also be used to create heat maps, a colour-coded visualisation of data.
💡 Trainer Insight:
One way to make your use of the AVERAGE function stand out is to compare your averages against dynamic benchmarks – like industry standards, previous months, or team targets. You can do this by using conditional formatting or helper formulas.
On our London Excel workshops, we often teach students to layer moving averages or weighted averages into dashboards, so the average isn’t just a number – it becomes a benchmark tool for spotting trends, anomalies, and even forecasting.
What Is The AVERAGE Function Useful For?
Similar Useful Functions
Other functions similar to the average function that are easy for you to include:
- MEDIAN: Finds the midpoint of your data
- AVERAGEIF: Averages your dataset if a condition is met
- MODE: Calculates the most frequently occurring value in your data
Conclusion
The AVERAGE function is a staple in Excel’s suite of tools, offering a straightforward way to analyse sets of numbers.
It’s essential for anyone looking to quickly find the central tendency of data, from simple personal tasks to complex business analyses.
For a business focused example, see how AVERAGE can make a moving average forecast here.


- Facebook: https://www.facebook.com/profile.php?id=100066814899655
- X (Twitter): https://twitter.com/AcuityTraining
- LinkedIn: https://www.linkedin.com/company/acuity-training/