Power BI Terms Explained: A Glossary for Beginners
Contents
Power BI has its own jargon and language.
Whether you’re exploring a dashboard, chatting in a team, or diving into Power BI training, understanding key terms helps you make sense of it all – fast.
Here’s your go-to guide!
Why You Need To Learn Terms
One thing we see in every Power BI course we teach? Learners who understand the basic terminology get up to speed much faster.
Knowing the difference between a dashboard and a report, or what a measure does compared to a column, helps you follow instructions, ask better questions, and get hands-on sooner.
It’s like learning the rules of the road before driving, it makes everything smoother and gives you the confidence to explore more advanced features as you go.
⚙️ Common Power BI Terms
Power BI Desktop
The Windows app designers use to connect, clean, model, visualise, and publish data – saved as .pbix files.
Power BI Service
The cloud-based platform (web/mobile) for sharing and viewing dashboards and reports.
Workspace
A shared container in the Service that holds dashboards, reports, and datasets—supports collaboration and management.
App
A bundled Power BI package of dashboards, reports, and data models designed for sharing across groups.
Pro Tip: A Power BI course with a good instructor will be able to teach you any terms you don’t understand.
📈 Data & Modelling Terms
Data Connector / Connector
Pre-built links that let Power BI import data from sources like SQL Server, Excel, web APIs, and more.
Dataflow
ETL workflows built within Power BI Service to prep and reuse transformed data.
Data Model / Semantic Model
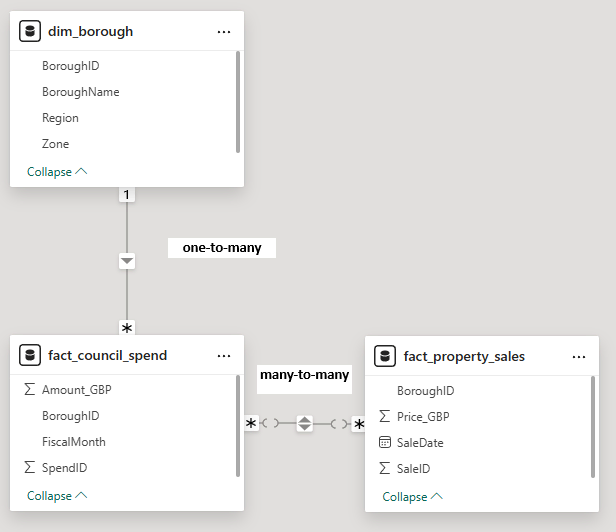
A structured definition of tables, fields, and relationships that underpins all your visuals and analytics.
Measure / Explicit Measure
A custom formula (using DAX) created and saved in the data model for calculations like sums or averages.
Implicit Measure
An automatic aggregation created by dragging a field into a visual (sum, count, etc.) without writing DAX.
🎨 Reporting Terms
Report
A multipage collection of visuals based on a data model—designed in Desktop and published to the Service.
Dashboard
A single-page canvas in the Service that aggregates visuals (tiles) from one or more reports.
Visual / Visualization
Any chart, table, or visual element (bar chart, map, KPI card) you add to a report or dashboard.
Tile
A single visual that’s pinned from a report onto a dashboard.
Bookmark
A snapshot of current filters, slicers, drill state, and view mode in a report—used for storytelling.
🔄 Interaction Terms
Filter vs Highlight
-
Filter removes data not meeting the criteria
-
Highlight dims unselected data points while keeping the rest visible
Drill Down / Drill Up / Drill Through
Navigate through data hierarchies – drilling down reveals detail drill up shows summarises, and drill-through opens a focused page.
Q&A
Natural-language feature, letting users ask questions (e.g., “total sales by region?”) and get visuals instantly. This is also known as Q&A visuals.
🔧 Advanced & Admin Terms
Gateway (On-premises Data Gateway)
A secure bridge that refreshes Service data with on-premises sources.
Row-level Security (RLS)
Restricts dataset rows based on user roles, ensuring people only see what they’re allowed to.
Capacity / Premium Capacity
Dedicated compute resources in the Microsoft Cloud—required for large deployments and sharing with free users.
🧮 DAX & Power Query Essentials
Power Query
Microsoft’s ETL engine used in Power BI (and Excel) for extracting, transforming, and loading data.
DAX (Data Analysis Expressions)
The formula language for writing measures, calculated columns, and tables across Power BI and related tools. This is a more advanced feature of Power BI, which is why we have specific Introduction To DAX courses.
Why This Matters
Knowing these terms empowers you to:
-
Navigate Power BI confidently
-
Understand training materials and documentation
-
Communicate clearly with teammates and stakeholders
Your Next Steps
-
Bookmark this page as a quick reference.
-
Try spotting these terms in your next Power BI project.
-
Learn one new feature a week – like setting up a Gateway or writing a simple DAX measure.
- Facebook: https://www.facebook.com/profile.php?id=100066814899655
- X (Twitter): https://twitter.com/AcuityTraining
- LinkedIn: https://www.linkedin.com/company/acuity-training/


