The Best Ways To Learn Power BI
Contents
Power BI is one of the most powerful tools for transforming raw data into interactive, insightful dashboards and reports.
As more businesses seek data-driven decision-making, mastering Power BI has become an essential skill for analysts, business intelligence professionals, and even non-technical business users.
Whether you’re just starting out or looking to deepen your expertise, this guide will walk you through the best ways to learn Power BI efficiently and effectively.

1. Attend A Power BI Course
Structured learning can dramatically accelerate your progress, and nothing beats a highly-rated Power BI course led by experienced professionals. Classroom or virtual courses provide the benefit of live instruction, hands-on exercises, and real-time feedback. This is particularly valuable for beginners who need foundational knowledge, as well as professionals seeking to fill specific skill gaps.
Expert-led courses often cover the full spectrum of Power BI, from Power Query & DAX (Data Analysis Expressions), to creating compelling visualizations and sharing reports. Opting for a course run by instructors with real-world consulting experience ensures practical insights beyond theory.

2. Understand the Basics of Power BI
Before diving into complex topics, it’s essential to grasp the core components of Power BI: Power BI Desktop, Power BI Service, and Power BI Mobile. Each part plays a role in creating and sharing reports.
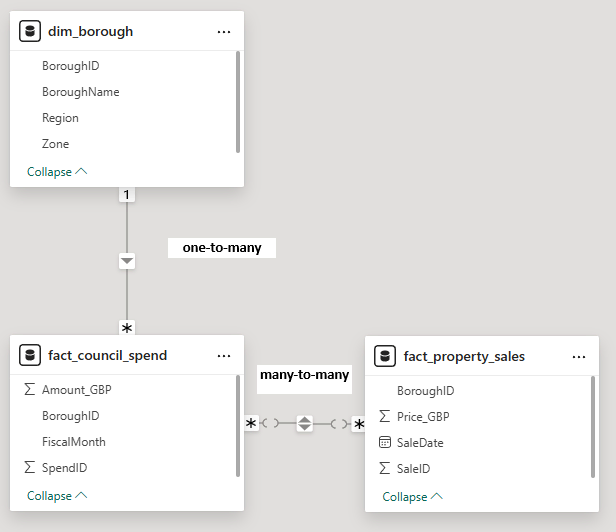
Start by exploring the user interface, learning how to import data from Excel or databases, and understanding how to clean and transform data using Power Query Editor. At this stage, developing an understanding of tables, relationships, and basic data modelling is crucial.
In training sessions, we often see delegates struggle with charts that don’t behave as expected – usually because fields are in the wrong format or relationships haven’t been set up.
Before building any visuals, always double-check your data types and table relationships. This simple step prevents 80% of the issues beginners encounter.

3. Choose the Right Learning Path for You
Everyone learns differently. Some prefer structured learning, while others thrive in a self-paced environment.
Interactive platforms often include quizzes, real-world projects, and progress tracking, making them ideal for learners who prefer flexibility. On the other hand, books, blogs, and YouTube channels can offer more ad-hoc learning for specific tasks!
Our blog has step-by-step content designed to help you learn Power BI’s features, like this article on the dynamic countdown timer! Whichever route you choose, consistency is key. Set achievable learning goals and practice regularly.
4. Start with Core Concepts and Visuals
Understanding the types of visuals and when to use them is vital in Power BI. Charts, graphs, and slicers help turn raw data into stories. Begin by mastering simple visuals such as bar and line charts, and then progress to more advanced ones like combo charts and custom visuals.
Tools like the word cloud visual allow for engaging ways to display textual data. Learning when and how to use these tools builds the foundation for creating clear, actionable dashboards.
5. Practice With Real Projects
Theory alone isn’t enough. Applying your knowledge in real-world scenarios will cement your learning and highlight areas for improvement. Find open datasets online, or use data from your own work environment (with permission) to build projects.
Create dashboards to answer specific business questions, visualize KPIs, or track trends over time. Sharing your projects publicly via GitHub or LinkedIn can also build your portfolio and demonstrate your skills to potential employers.
- Facebook: https://www.facebook.com/profile.php?id=100066814899655
- X (Twitter): https://twitter.com/AcuityTraining
- LinkedIn: https://www.linkedin.com/company/acuity-training/


