
The 10 Star Schema Mistakes Everyone Makes
Contents
- 1 Mistake 1: Mixing Facts and Dimensions
- 2 Mistake 2: Missing or Weak Keys
- 3 Mistake 3: Overusing Many to Many Relationships
- 4 Mistake 4: Relying on Auto Date or Missing a Proper Date Table
- 5 Mistake 5: Unnecessary Snowflaking
- 6 Mistake 6: Using Too Many Bi-directional Filters
- 7 Mistake 7: Poor Naming Conventions
- 8 Mistake 8: Mixing Granularity Inside Fact Tables
- 9 Mistake 9: Wrong or Inconsistent Data Types
- 10 Mistake 10: Skipping Model Validation Before Building Visuals
- 11 Final Thoughts
Ever had problems with your DAX that just don’t make sense?
Sometimes the culprit isn’t actually your DAX, it’s your data model.
Star schema mistakes are incredibly common in Power BI, and really hard to track down.
When your data model isn’t a clean star schema, you end up with broken filters, confusing relationships and slow visuals.
It’s important to get it right from the start! So we broke down the top 10 most common mistakes people make, how to identify them and how to fix them!
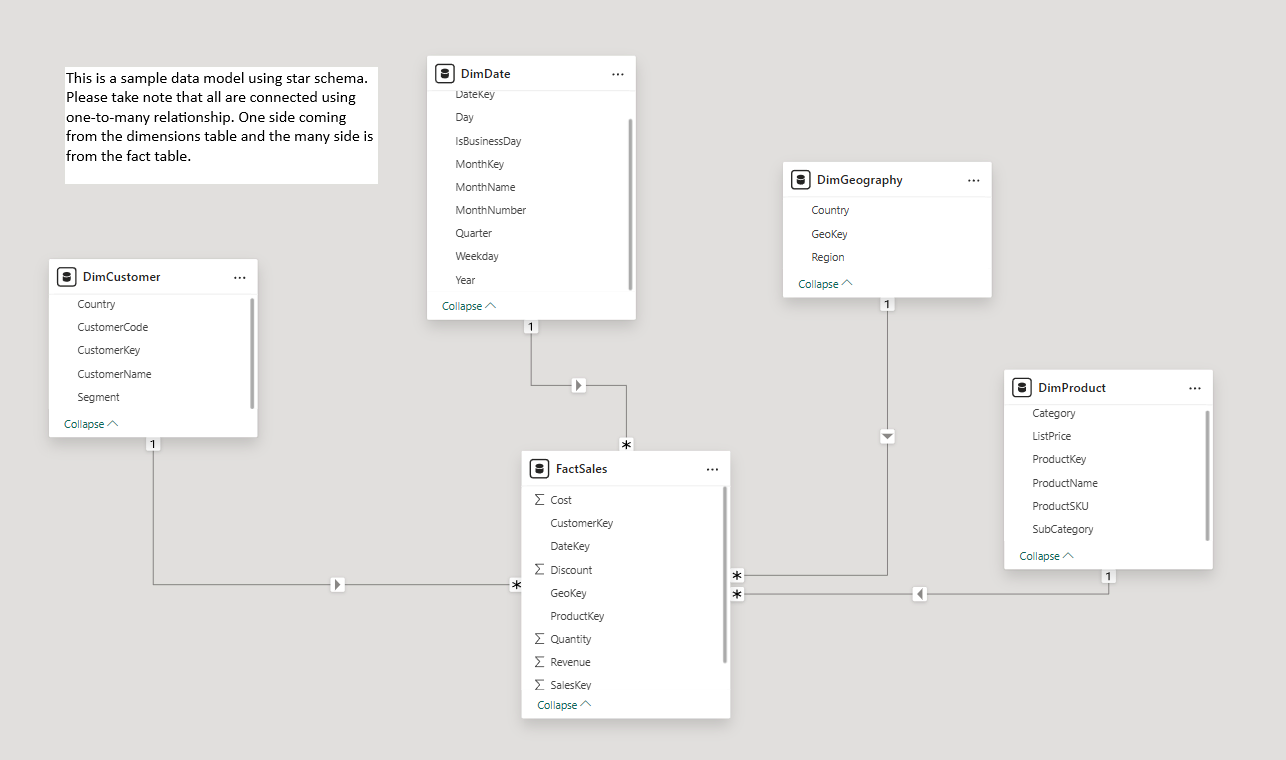
Mistake 1: Mixing Facts and Dimensions
Why it happens:
Users coming from Excel often treat every column as equal, placing descriptive fields and numeric transactions in the same table.
Symptoms:
- Duplicated values
- Incorrect totals
- Filters that behave unpredictably
How to fix it:
Identify the grain of your fact table.
The grain is the level of detail each row represents, such as one transaction, one daily total etc. Every row in the table must follow this rule.
Move descriptive attributes such as product names or customer segments into separate dimension tables.
Keep the fact table clean, it should contain numeric measures and foreign keys only.
If these modelling basics feel new to you, our London based Power BI training can give you a complete walkthrough on data models.
Example:
Splitting a flat 30-column sales table into a FactSales table with four clean dimension tables reduced the model size by over 60%, and instantly fixed issues like duplicated revenue totals.
Mistake 2: Missing or Weak Keys
Why it happens:
Source systems don’t always include proper primary keys.
Users also often create concatenated keys that look unique, but aren’t.
Symptoms:
- Power BI blocks relationship creation
- Ambiguous relationship warnings
- Blank rows appearing in visuals
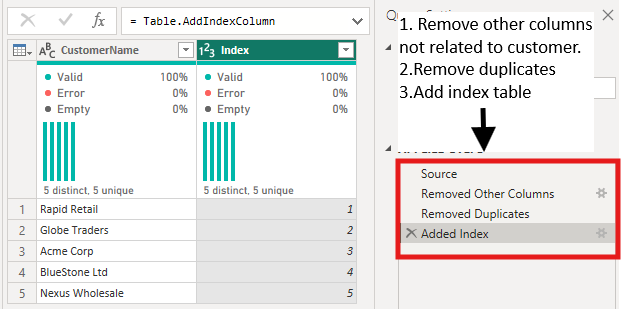
How to fix it:
Create surrogate keys in Power Query.
Remove duplicates, standardize text, and generate a numeric Index if needed.
Every dimension should have one clean, stable, unique key.
Example from our training!
Delegates often come to our post course support with filters that aren’t behaving as expected.
In most cases, this is often because they have a table like DimCustomer, which has duplicate customer ID’s.
Creating a numeric surrogate key can easily remove duplication and fix the filtering immediately.
Mistake 3: Overusing Many to Many Relationships
Why it happens:
Users connect tables directly instead of restructuring or normalising the data.
Symptoms:
- Unexpected totals
- Slow visuals
- Confusing or circular filter paths
How to fix it:
Prioritize one-to-many relationships whenever possible.
Introduce a bridge table to resolve the ambiguity.
Example:
A customer to segment mapping caused ambiguous filter paths.
Adding a bridge table stabilized the model and corrected segmentation metrics.
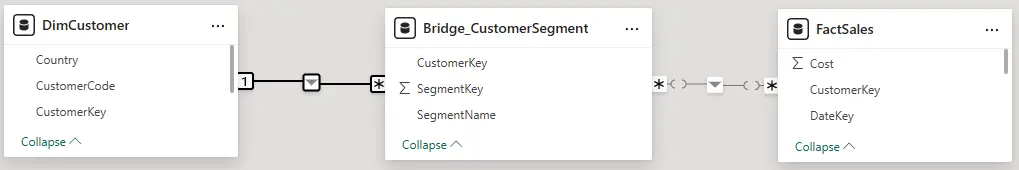
Relationship view showing a bridge table between customer and segment
Mistake 4: Relying on Auto Date or Missing a Proper Date Table
Why it happens:
Auto Date/Time creates hidden date tables.
Users also keep multiple date fields instead of using a central DimDate.
Symptoms:
- Incorrect time intelligence
- YTD or prior year totals that fluctuate
- Slower models caused by hidden date tables
How to fix it:
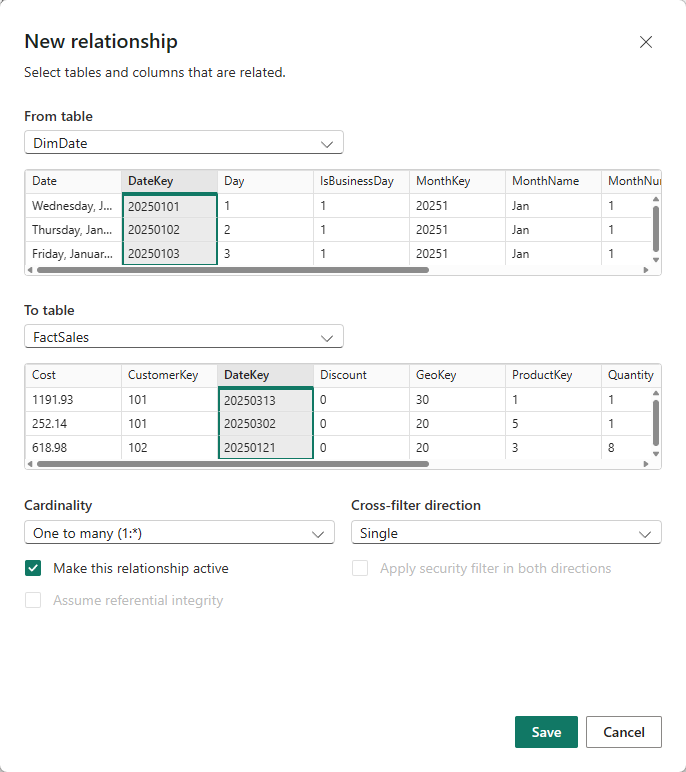
Create a proper DimDate table with continuous dates and fields such as Year, MonthName, Quarter, FiscalPeriod, and WeekNum.
Mark this table as the official date table so all time intelligence works properly.
You should also disable the Auto Date/Time feature, so Power BI does not generate hidden date tables that consume memory and cause inconsistent results.
Go to File > Options and Settings > Options > Global > Data Load and uncheck Auto Date/Time.
Example:
Replacing Auto Date/Time with DimDate reduced refresh time by more than half and fixed inconsistent YTD results.
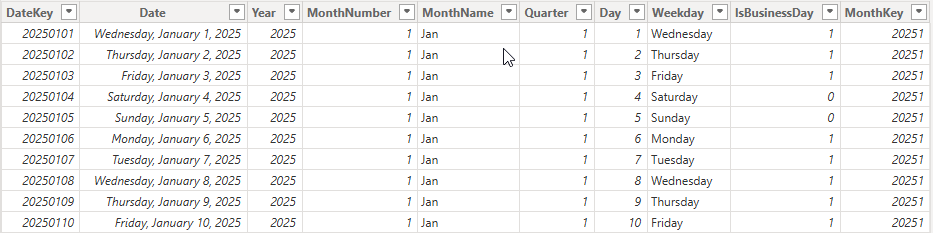
DimDate table with date attributes
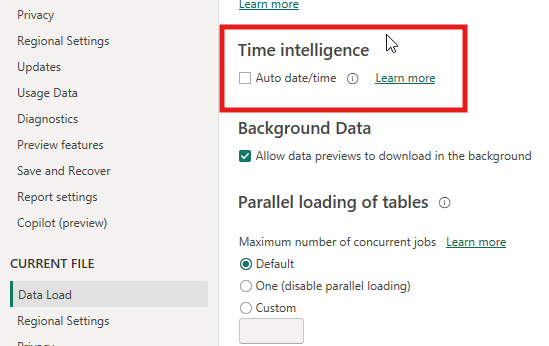
Options menu showing Auto Date/Time disabled
Mistake 5: Unnecessary Snowflaking
Why it happens:
Highly normalised source systems are imported “as-is,” creating multi-level lookup trees.
Symptoms:
- Long chains of lookup tables
- Hard-to-navigate models
- Slower visual and query performance
How to fix it:
Flatten related lookup tables during import.
Move category/subcategory data into DimProduce or similar single-dimension structures.
Example:
Flattening category tables into DimProduct removed two joins and improved visual responsiveness significantly.
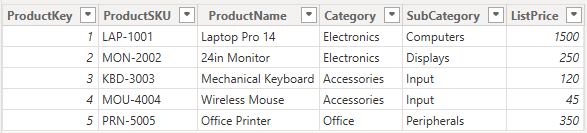
Flattened DimProduct
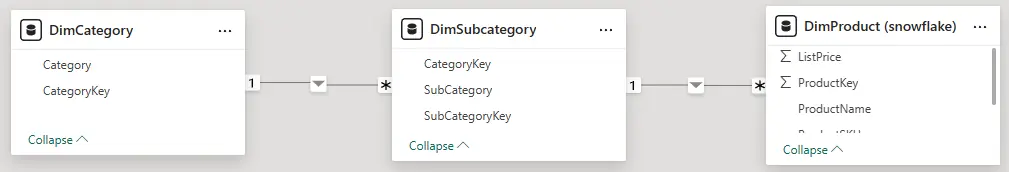
Snowflaked DimProduct
Mistake 6: Using Too Many Bi-directional Filters
Why it happens:
Users turn on bidirectional filtering to fix a calculation without understanding the consequences.
Symptoms:
- Slow visuals
- Circular dependency errors
- Totals that change unexpectedly
How to fix it:
Use single direction filtering as the default.
If cross-filtering is needed for a specific scenario, use CROSSFILTER within a measure rather than changing the relationship settings.
Example:
Removing six unnecessary bidirectional filters improved page load time from almost four seconds to less than one second.
Mistake 7: Poor Naming Conventions
Why it happens:
Quick imports result in inconsistent or unclear names.
Symptoms:
- Confusing field selections
- Slower onboarding for new users
How to fix it:
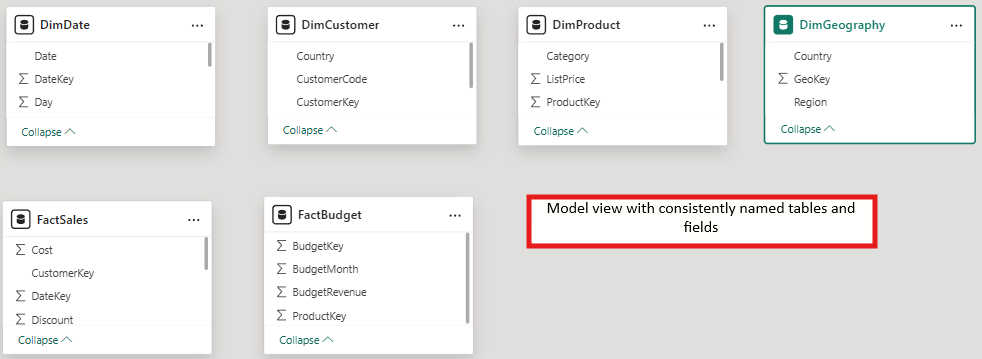
Use a simple naming standard such as FactSales, DimProduct, and DimCustomer.
Ensure column names are descriptive, such as ProductName or CustomerSegment.
Example:
Consistent naming reduced report build time for new developers by roughly forty percent.
Mistake 8: Mixing Granularity Inside Fact Tables
Why it happens:
Users combine transactional data with summaries or snapshots.
Symptoms:
- Incorrect totals
- Duplicate or mismatched records
- Filters that do not align with the intended grain
How to fix it:
Define a clear grain for each fact table.
Store budgets, forecasts, and inventory snapshots in separate fact tables, each with its own consistent granularity.
Example:
Separating weekly summary data from daily transactions eliminated a twelve percent underreporting issue.
Mistake 9: Wrong or Inconsistent Data Types
Why it happens:
Poorly formatted source files bring text dates, number-like text fields, or inconsistent types into the model.
Symptoms:
- Relationship errors
- Incorrect calculations
- Slower performance due to poor compression
How to fix it:
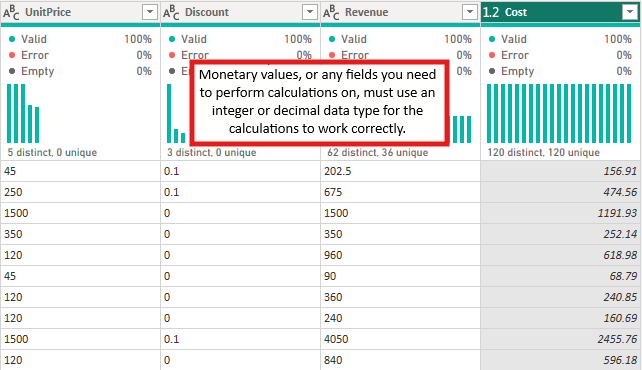
Assign correct and consistent data types.
Microsoft’s Power BI modelling guidance tells us that incorrect data types and text-based keys can dramatically increase your model size, which has a big impact on your performance. Using numeric surrogate keys and proper Date data types helps improve Vertipaq compression, resulting in faster filtering and more efficient joins.
Numeric surrogate keys provide much better compression, faster filtering, and more efficient joins.
If your source uses a text-based natural key, store the original text as an attribute and use a numeric surrogate key for relationships.
Example:
Converting a text date column to a real Date type and switching text-based keys to integer surrogates reduced the model size significantly and improved query performance.
Mistake 10: Skipping Model Validation Before Building Visuals
Why it happens:
Analysts dive straight into visuals without ensuring the model works correctly.
Symptoms:
- Errors discovered late in development
- Totals break once slicers are applied
- Measures must be rewritten
How to fix it:
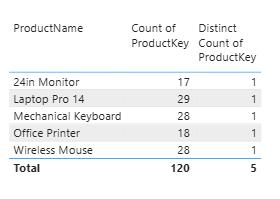
Validate the model early.
Use simple table visuals to test distinct counts, totals, and filter paths.
Confirm that each dimension filters the fact table as expected before building dashboards.
Example:
A quick relationship test identified a customer key issue within minutes, preventing a full report rebuild later.
Final Thoughts
Star schema mistakes are very common! Most of us have made a lot of these mistakes without ever realising it. Once you understand how facts, dimensions, keys and relationships are meant to work – the rest will become easier.
Getting the data model right isn’t just about laying all your data out, it’s the foundation that everything else is built on!
So before you start looking into your measures or visuals for issues, make sure that foundation is solid.


- Facebook: https://www.facebook.com/profile.php?id=100066814899655
- X (Twitter): https://twitter.com/AcuityTraining
- LinkedIn: https://www.linkedin.com/company/acuity-training/