
Complete Guide To Percentages in Excel!
Contents
- 1 What is a Percentage?
- 2 Calculating a Simple Percentage in Excel
- 3 Calculating a Simple Percentage in Microsoft Word
- 4 How to Update Formulas in a Word Table
- 5 Working with Percentages
- 6 Calculating the Percentage of a Known Total
- 7 Calculating Percentage Change
- 8 Increase or Decrease an Amount by a Percentage
- 9 Calculating a Simple Percentage in PowerPoint by Using VBA
- 10 Learning Objectives
- 11 Conclusion
In this article, we will demonstrate how to calculate a percentage in Microsoft Excel, Word and PowerPoint.
Additionally, we will go through some other important percentage related calculations.
What is a Percentage?
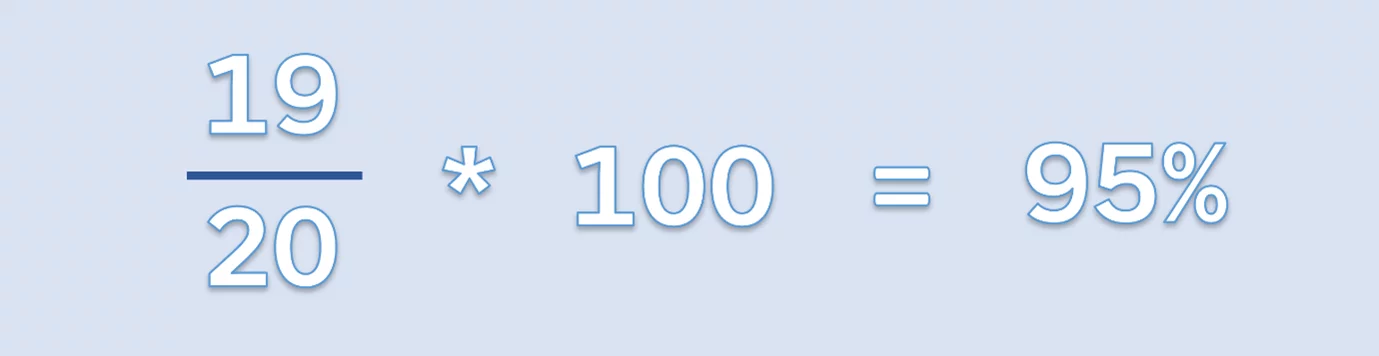
A percentage is defined, as a part or a portion of a greater whole. A percentage is a number that is conveyed as a fraction of a 100. To calculate a simple percentage, you would use the following formula.

So, for example if you scored 19 out of 20 for an English Test. You would calculate your percentage as follows.
Calculating a Simple Percentage in Excel
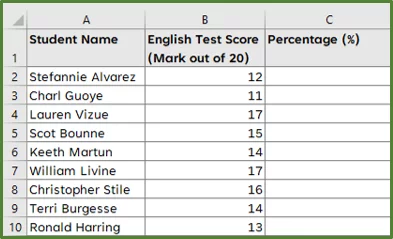
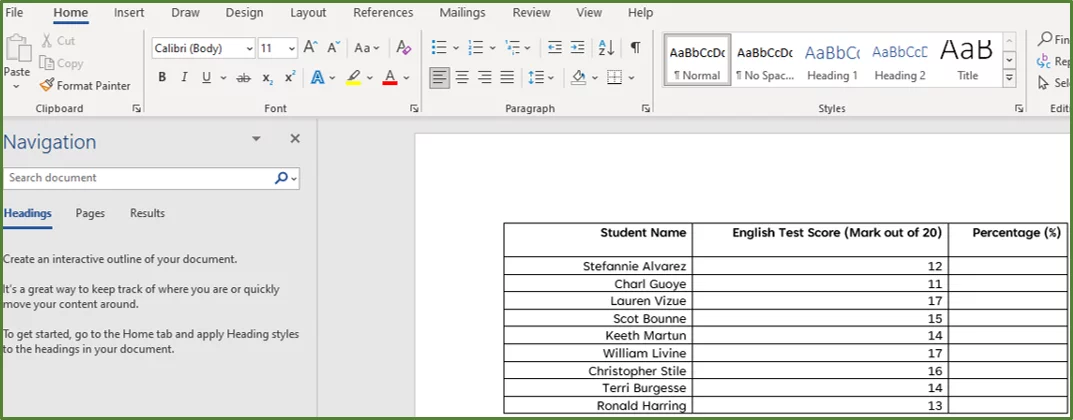
We have a list of students and their corresponding test scores.
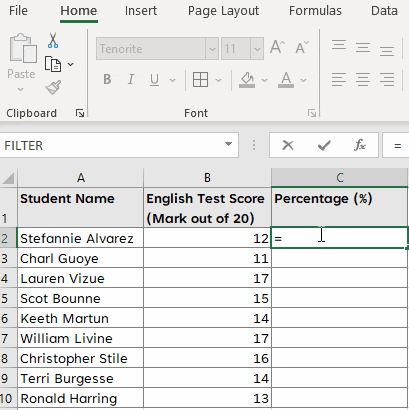
To calculate each student’s percentage, we start by entering the following formula in cell C2.
=(B2/20)*100
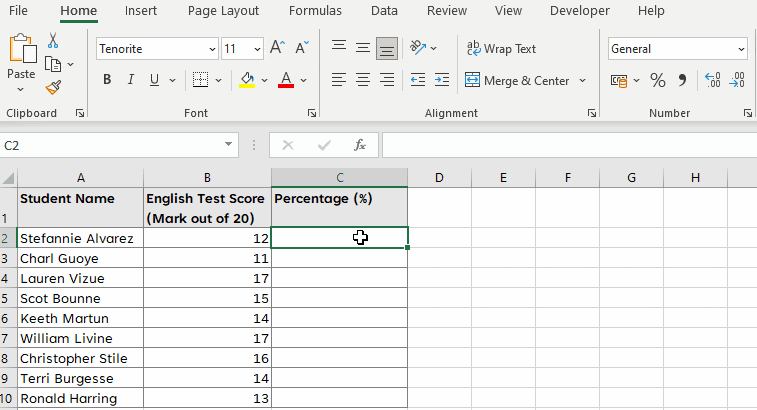
Press Enter and then drag the formula down the column.
Another way, of calculating the student percentages is by doing the following.
Using the same list of students, as in our above example, enter the following formula in cell C2.
=(B2/20)
Press Enter and then drag the formula down the column. Now select the range C2:C10. With the range selected, go to the Home Tab and in the Number Group, select % to apply the Percent Formatting.
Calculating a Simple Percentage in Microsoft Word
You can calculate simple percentages, easily in a table in Microsoft Word.
So let’s first create our table.
Open a blank document in Word. Go to the Insert Tab and in the Tables Group, select Table.
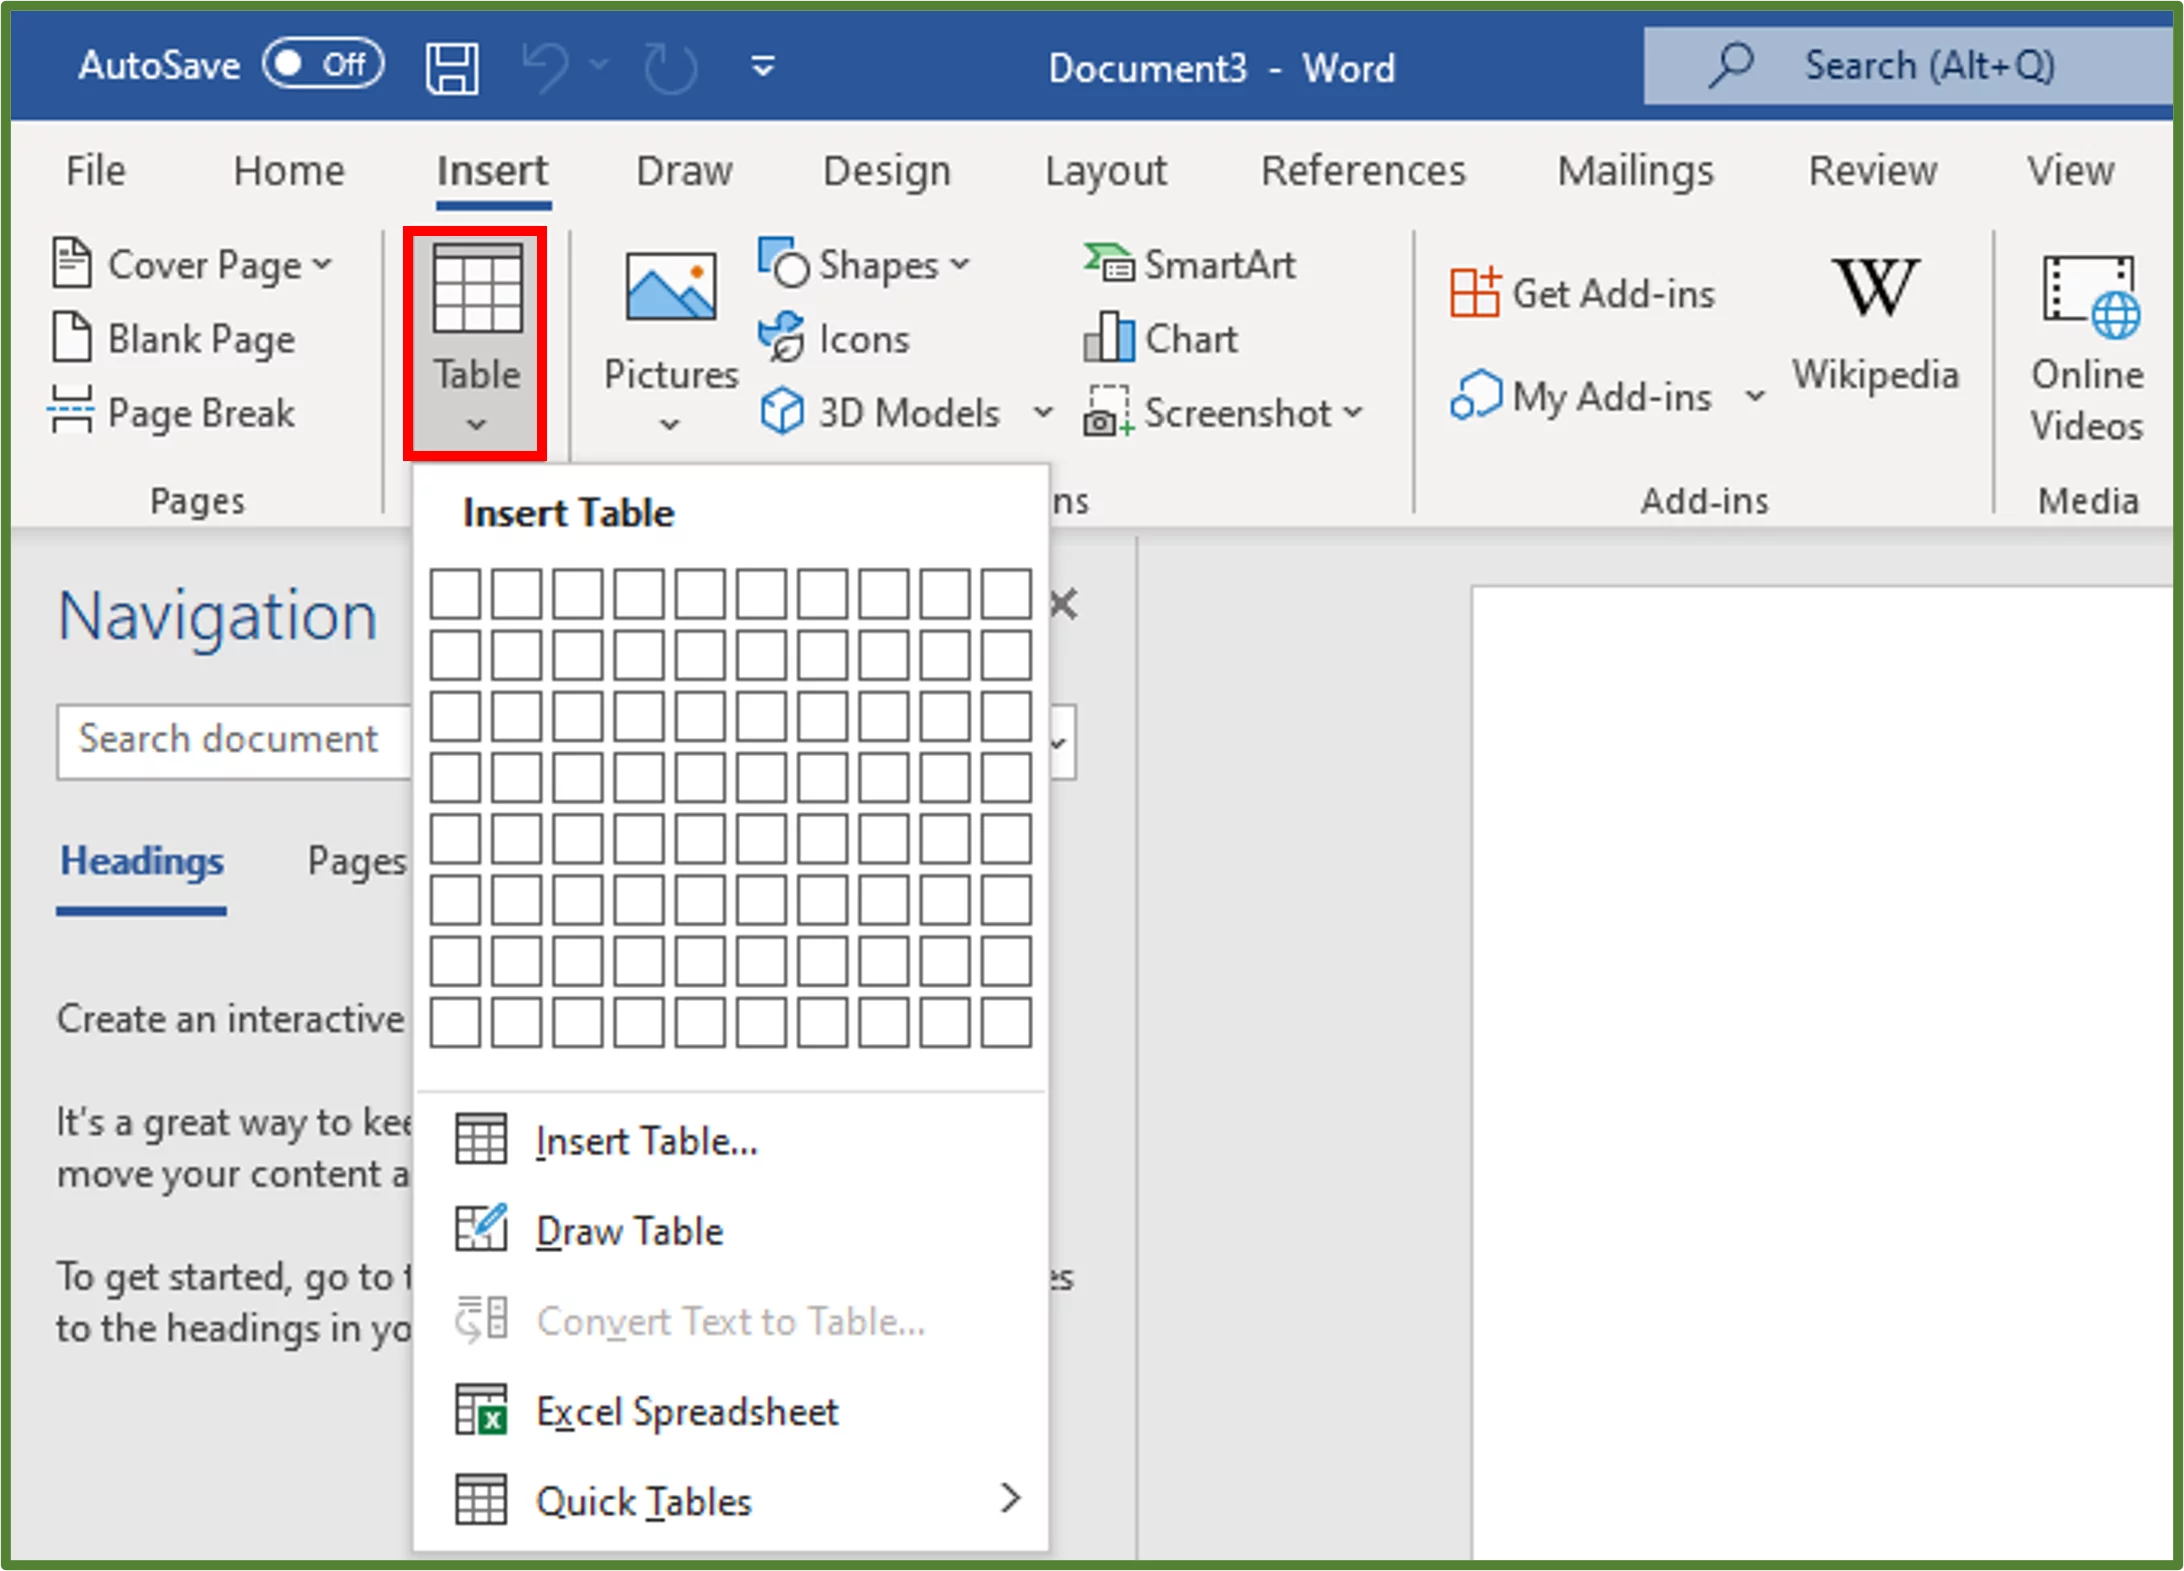
Select the Insert Table… option. Using the Insert Table Dialog Box, set the Number of columns to 3 and the Number of rows to 10.
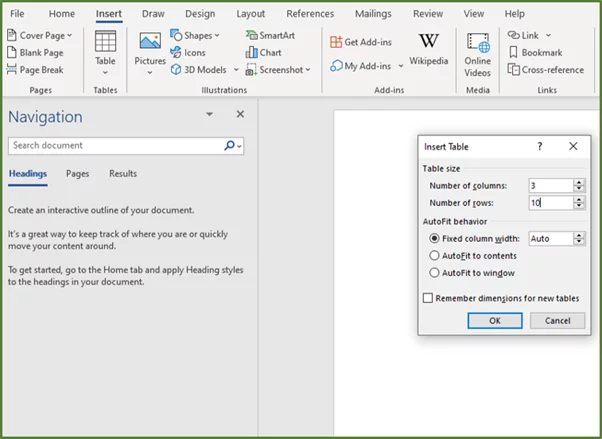
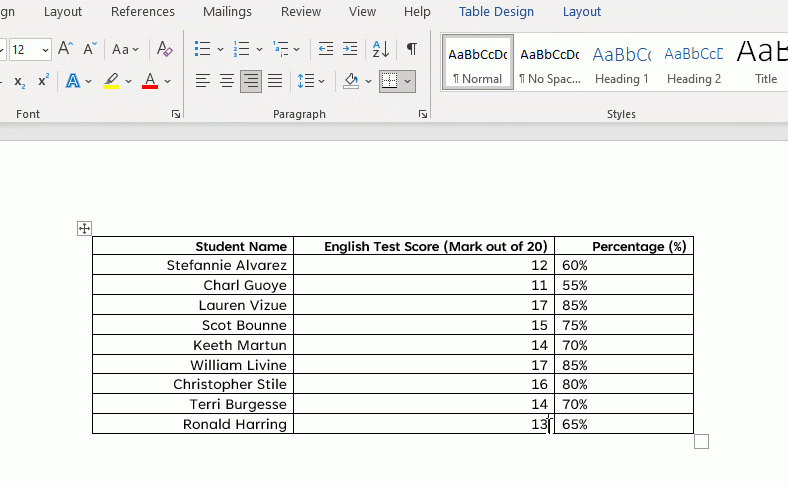
Click Ok. Enter the three headings, the student names and their test scores in the Table.
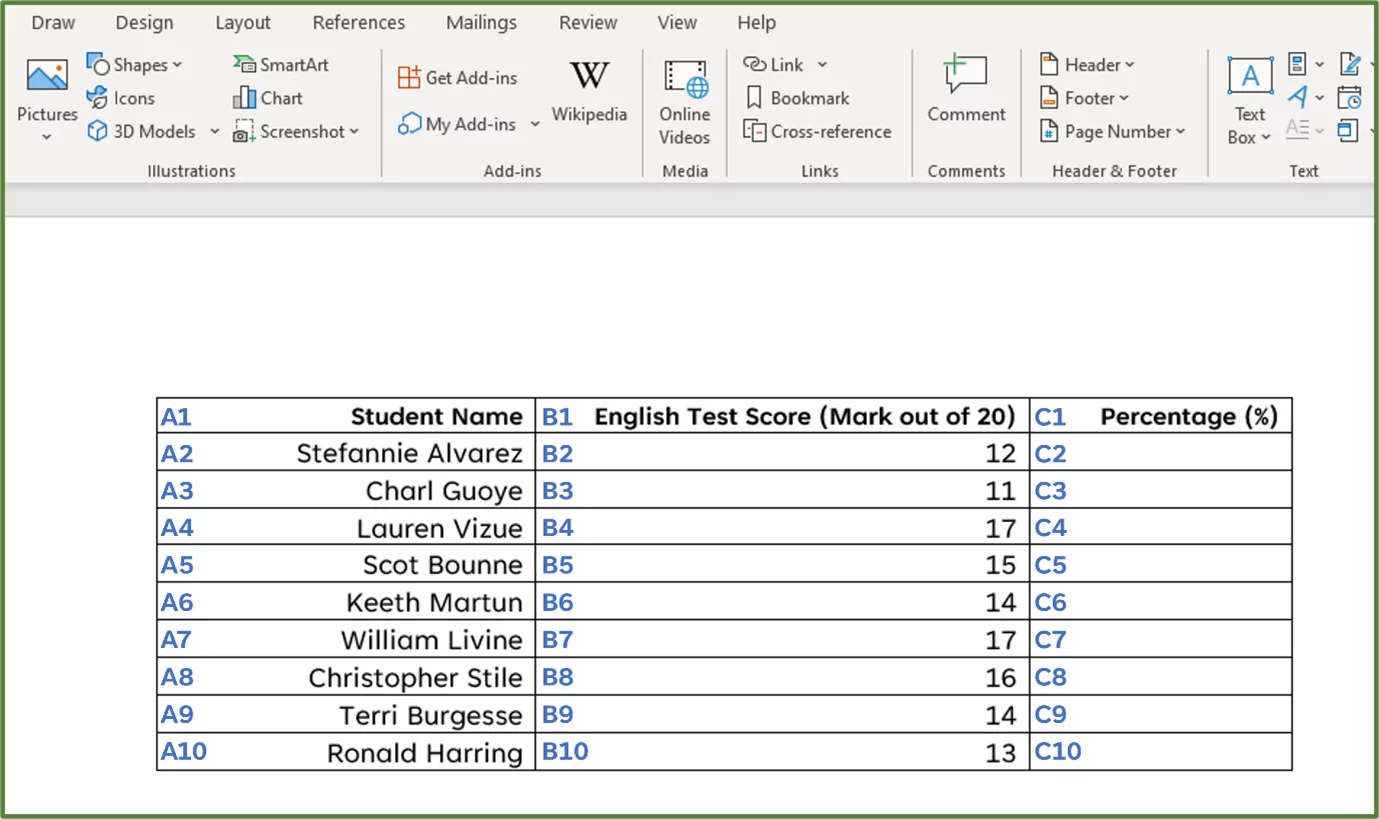
When entering formulas in a Word Table, you need to use a referencing style to refer to specific cells. You can use the RnCn referencing style or the A1 referencing convention.
In this example, we will use the A1 referencing convention. So the first cell in the first column and in the first row is A1. The cell in the second column and first row is B1.
In the diagram below, you can see the cells labeled according to the A1 referencing convention.
Place the cursor in cell C2. Go to the Layout Tab and in the Data Group, select Formula.
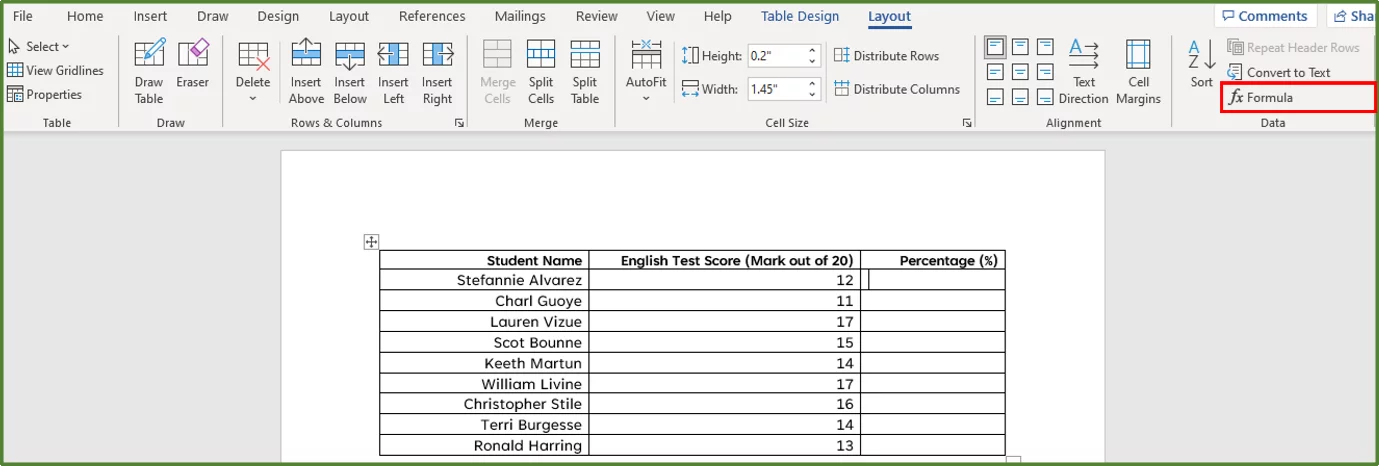
Using the Formula Dialog Box, enter the following formula
=(B2/20)*100
Select percent as the Number Format. Click Ok.
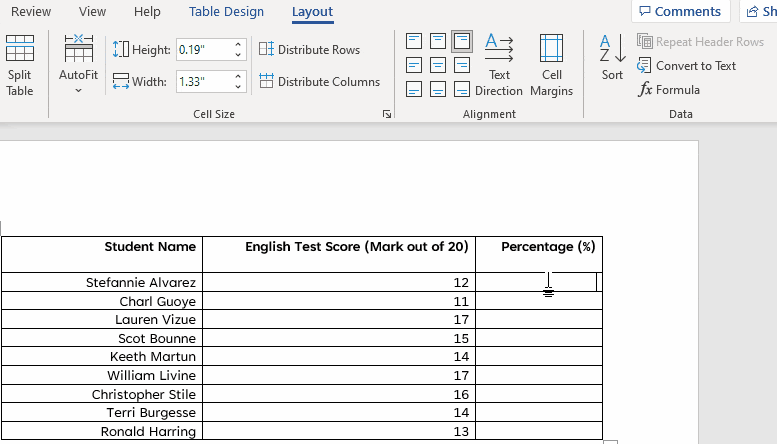
Now place your cursor in cell C3. Like we did before, go to the Layout Tab and in the Data Group, select Formula. Using the Formula Dialog Box, enter the following formula
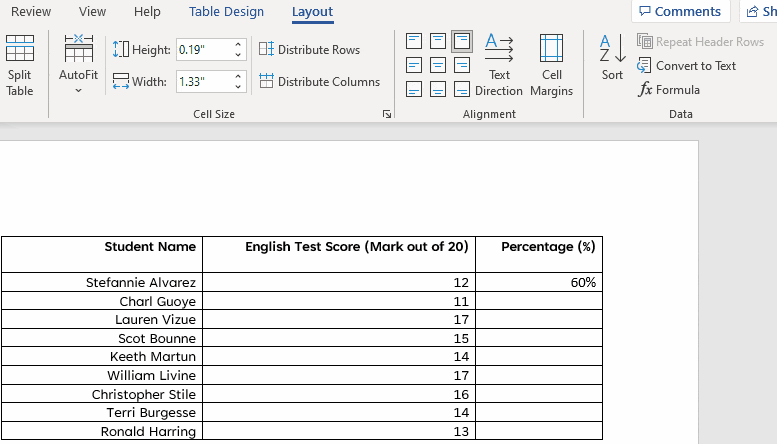
=(B3/20)*100
Select percent as the Number Format.
Click Ok.
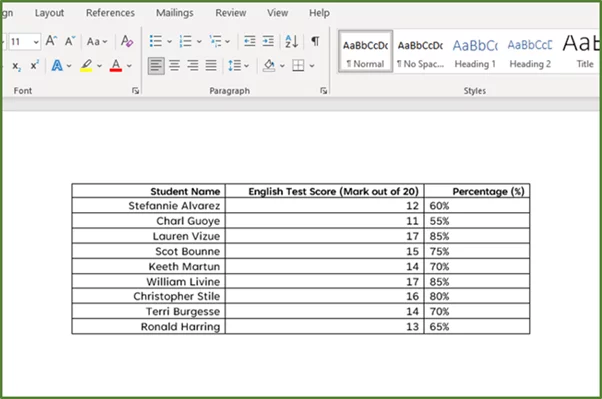
Do likewise for the rest of the column until you get the following.
Tip: Word doesn’t have the drag the formula down the column functionality that Excel has. So, it’s advisable to only use this method if you don’t have lots of rows of data and for simple calculations.
How to Update Formulas in a Word Table
Let’s say you have a situation where one of the student’s marks was entered incorrectly. The last student, Ronald Harring actually scored 15 and not 13. So unlike in Excel, the change wouldn’t be automatically reflected in cell C10.
We actually have to update the formula in cell C10.
So we enter the correct value of 15 in cell B10 first. To update the formula in cell C10, select it, then right-click and choose the Update Field option.
The percentage should now be 75%.
Working with Percentages
We are going to look at how to calculate the amount the student scored, if given a percentage and the total.
Let’s say one has a student who says his percentage on his English test was 65%. The test was out of 20. How would we calculate the actual mark he received? In this case we would use the following formula.

So this would work out to be.

So the student’s mark on the test was 13.
Let’s look at an example in an Excel spreadsheet.
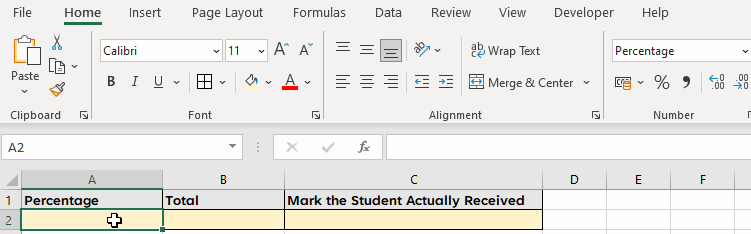
We have cell A2, already formatted as a percentage.
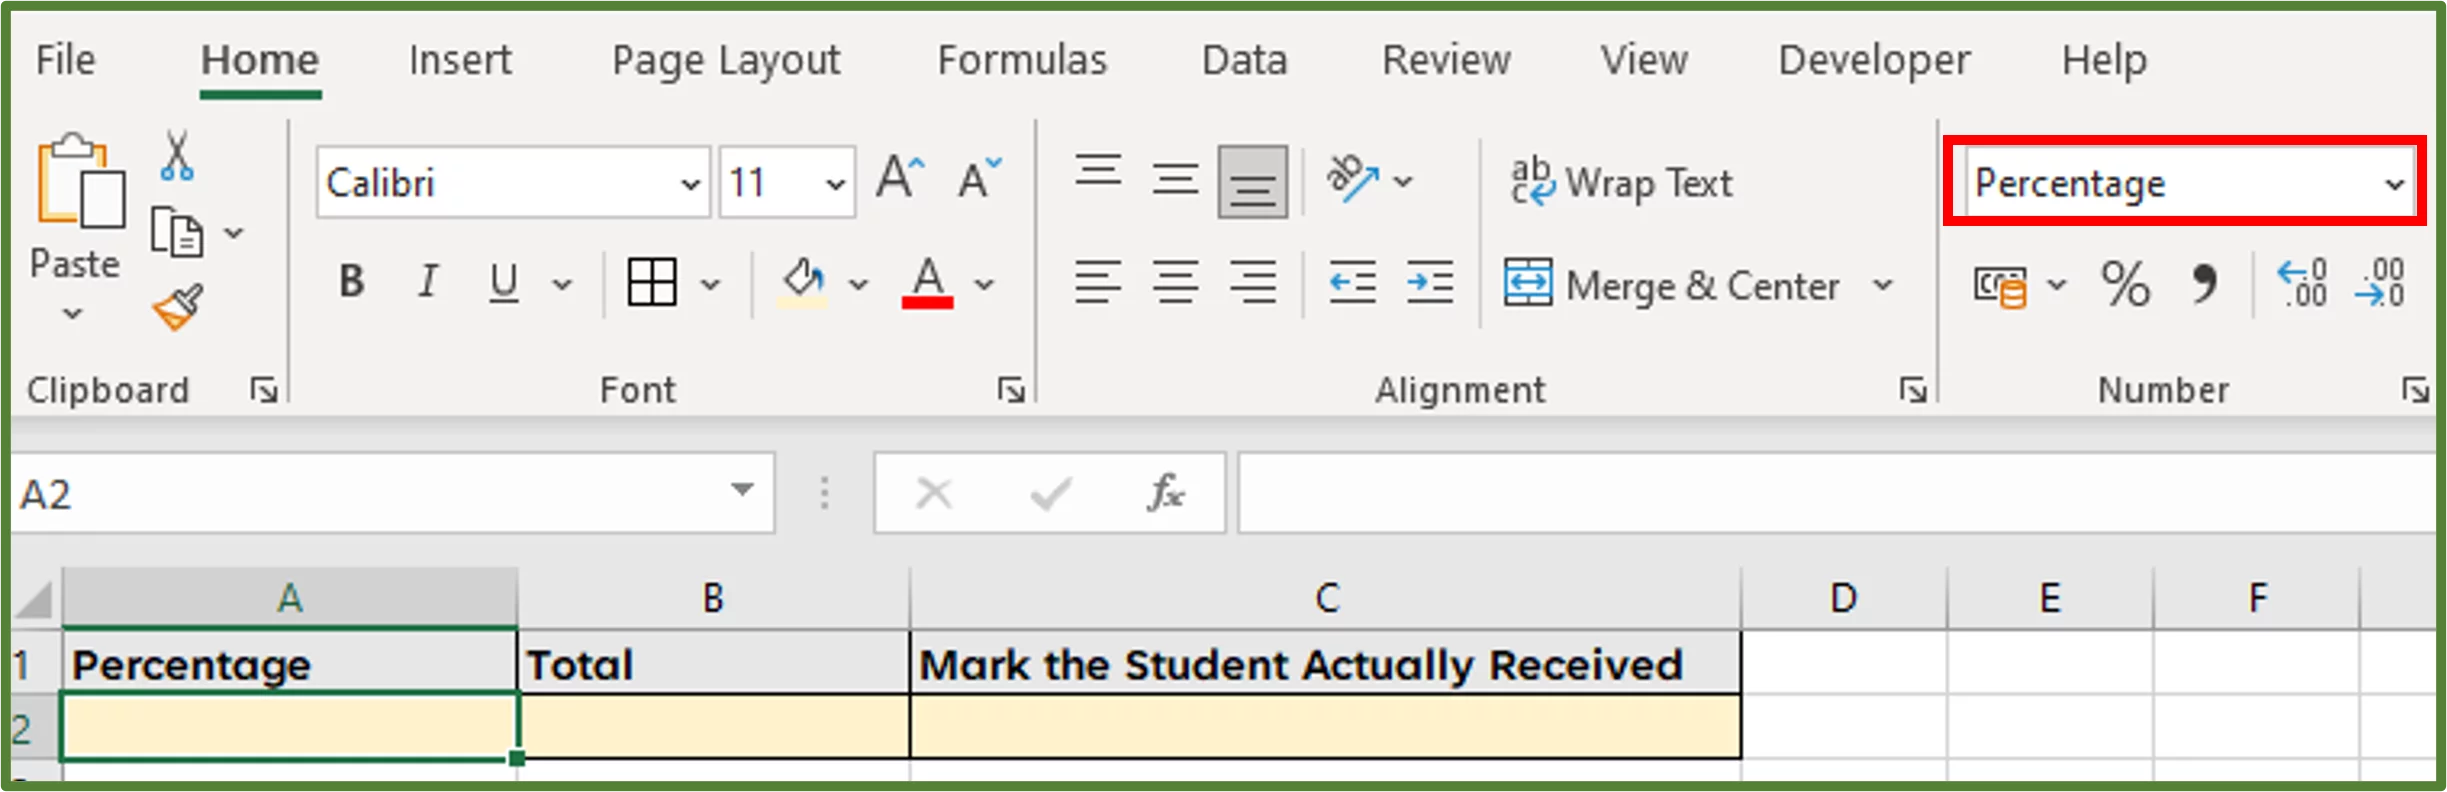
So we enter 65 directly in cell A2, and then 20 in cell B2. To calculate the actual mark the student received, in cell C2, we enter the following formula
=A2*B2.
Since A2 is already formatted as a percentage we don’t have to divide by 100. This is why we did this step first.
Calculating the Percentage of a Known Total
Let’s say you have a situation, where the known total is in a certain cell at the bottom of the table. You could calculate percentage using a combination of relative and absolute referencing.
To learn more about how to use relative, absolute and mixed cell references, please read here.
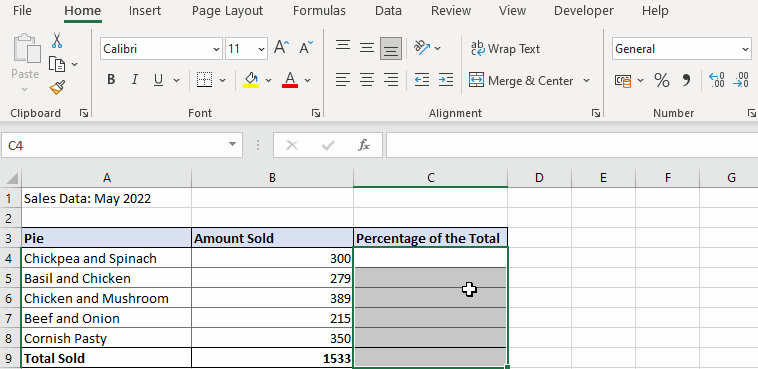
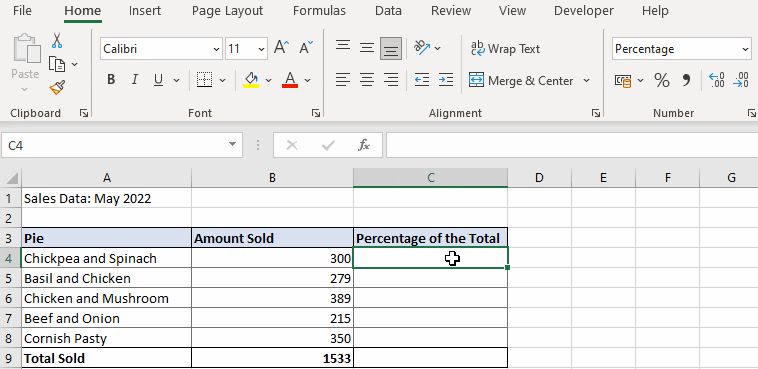
In our example below, a hypothetical bakery would like to compare the sales of their different pie options.
You can see we have the amount of each type of pie sold, and then the total number of pies sold is given in cell B9.
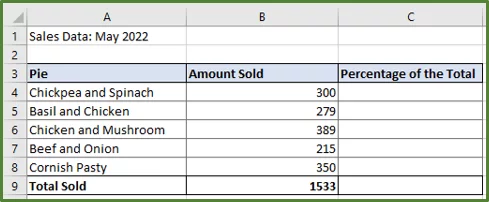
The first thing we need to do is apply the percentage formatting to range C4:C8. So select the range and then go to the Home Tab. In the Number Group, click on the Percentage Format.
Now in cell C4, enter the following formula =B4/$B$9. Press the F4 key in order to make the total an absolute reference. So that when we drag the formula down the column the reference is fixed. Increase the number of decimal places by 2.
Calculating Percentage Change
There maybe times when you have to calculate the percentage change between two values. The formula for percentage change is the following.

If the new value is greater than the old value then you have a percentage increase. Conversely if the old value is greater than the new value then you have a percentage decrease.
If you want to learn more about how percentages can help you with Excel then check out a Microsoft Excel course that runs in London!
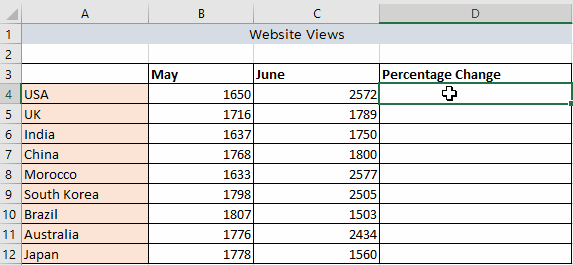
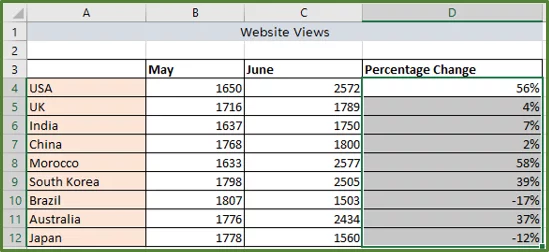
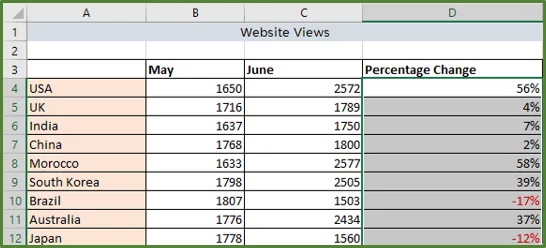
So let’s see how this works in Excel, by looking at a simple example. The owner of a new online shop, selling vintage watches has started to monitor her website views . She has the data for the first two months, she has been operating.
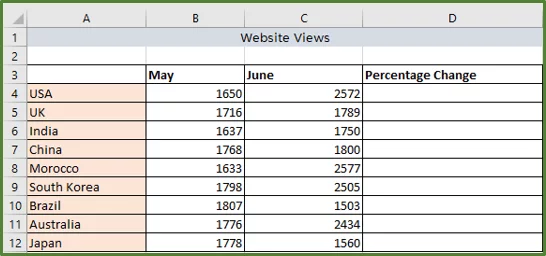
The first thing we have to do is apply the percentage format to range D4:D12. To calculate the percentage change in cell D4, enter the following formula.
=(C4-B4)/B4
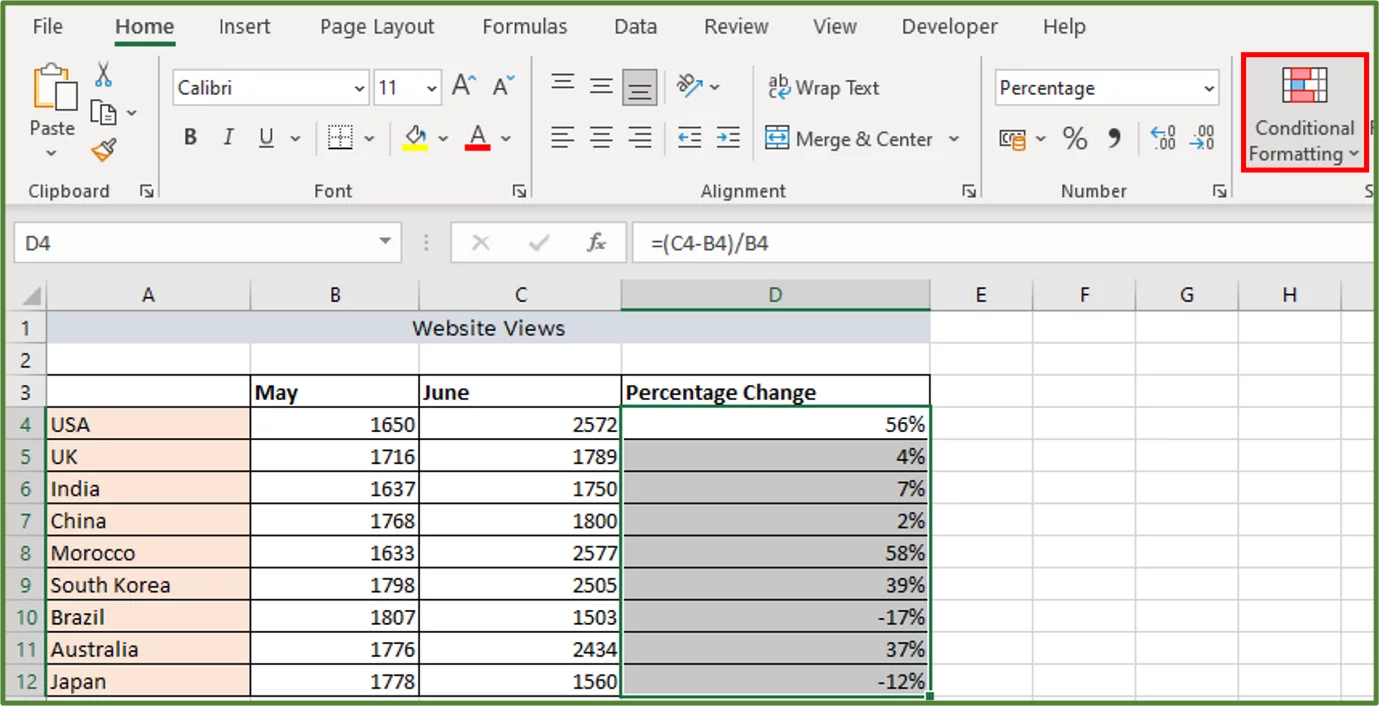
Now we can see for all the locations except Brazil and Japan, there has been a percentage increase. For Brazil and Japan, we would like to highlight that there has been a percentage decrease by using conditional formatting.
Select the range D4:D12.
Go to the Home Tab, and in the Styles Group, select Conditional Formatting.
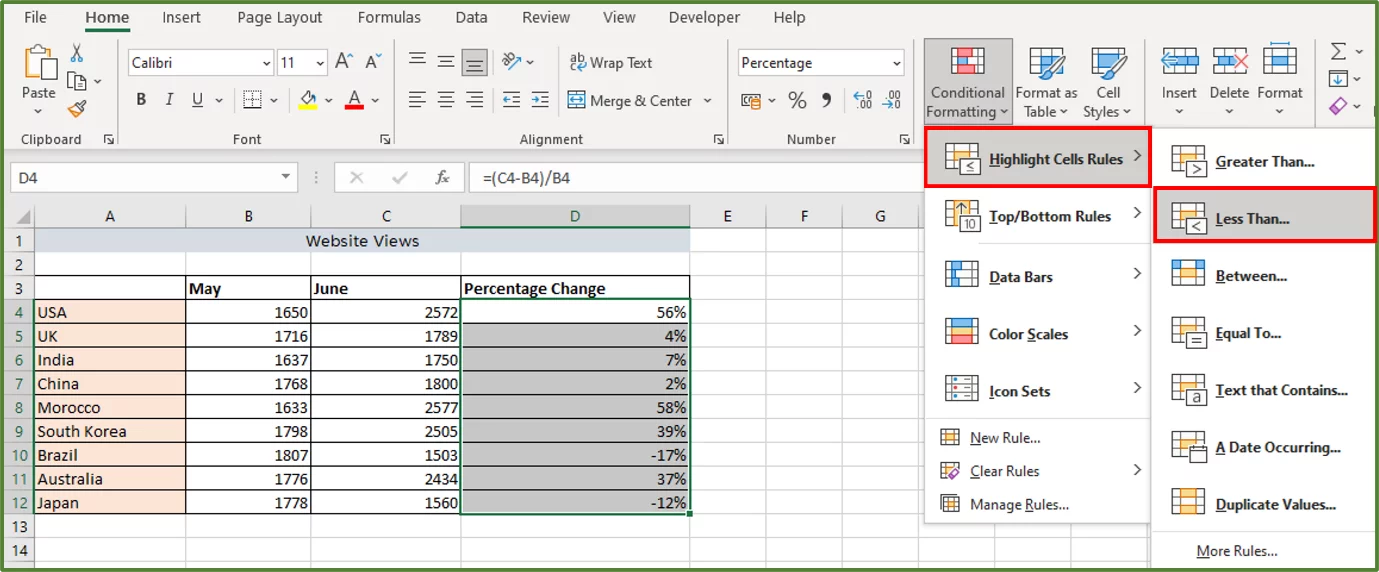
Select the Highlight Cells Rules option and then Less Than…
Using the Less Than Dialog Box, enter 0 and choose the Custom Format… option from the drop-down list.
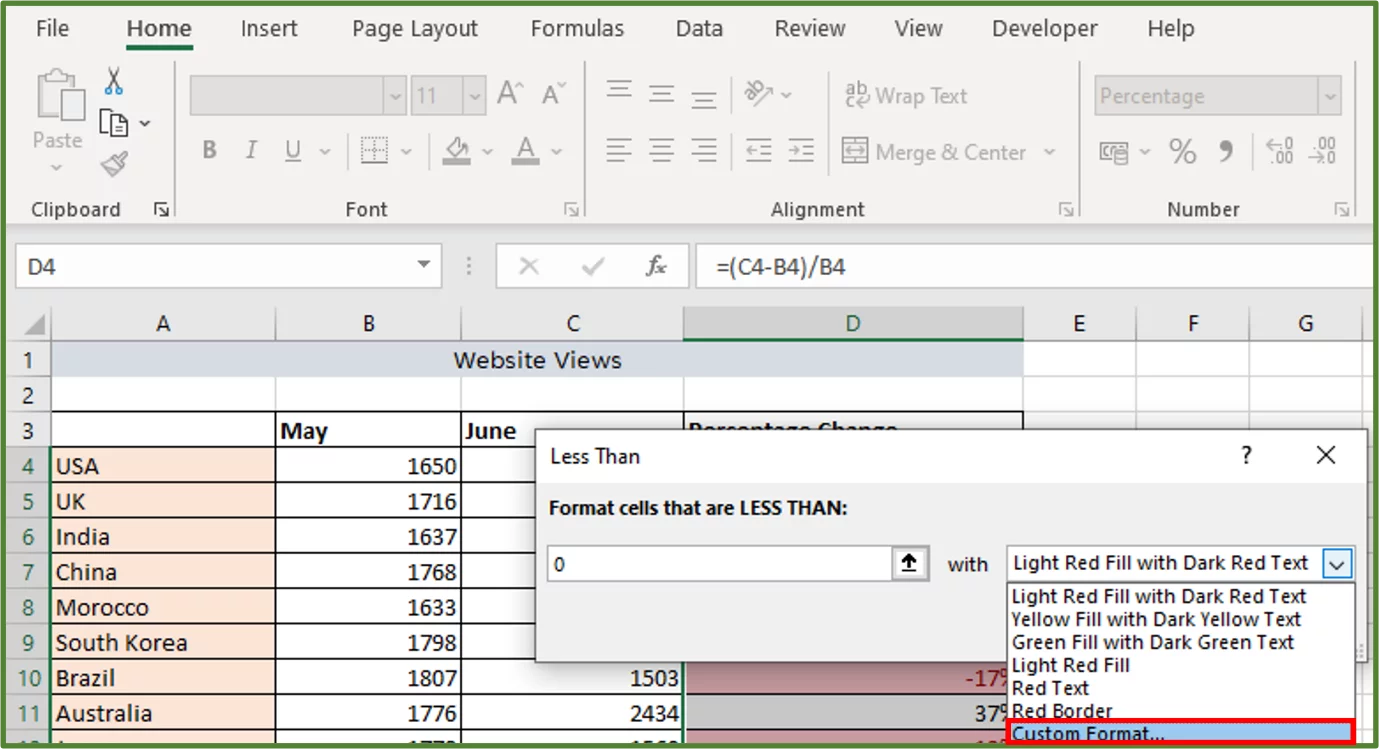
Using the Format Cells Dialog Box, select the Font option. Under Color choose Red as shown below.
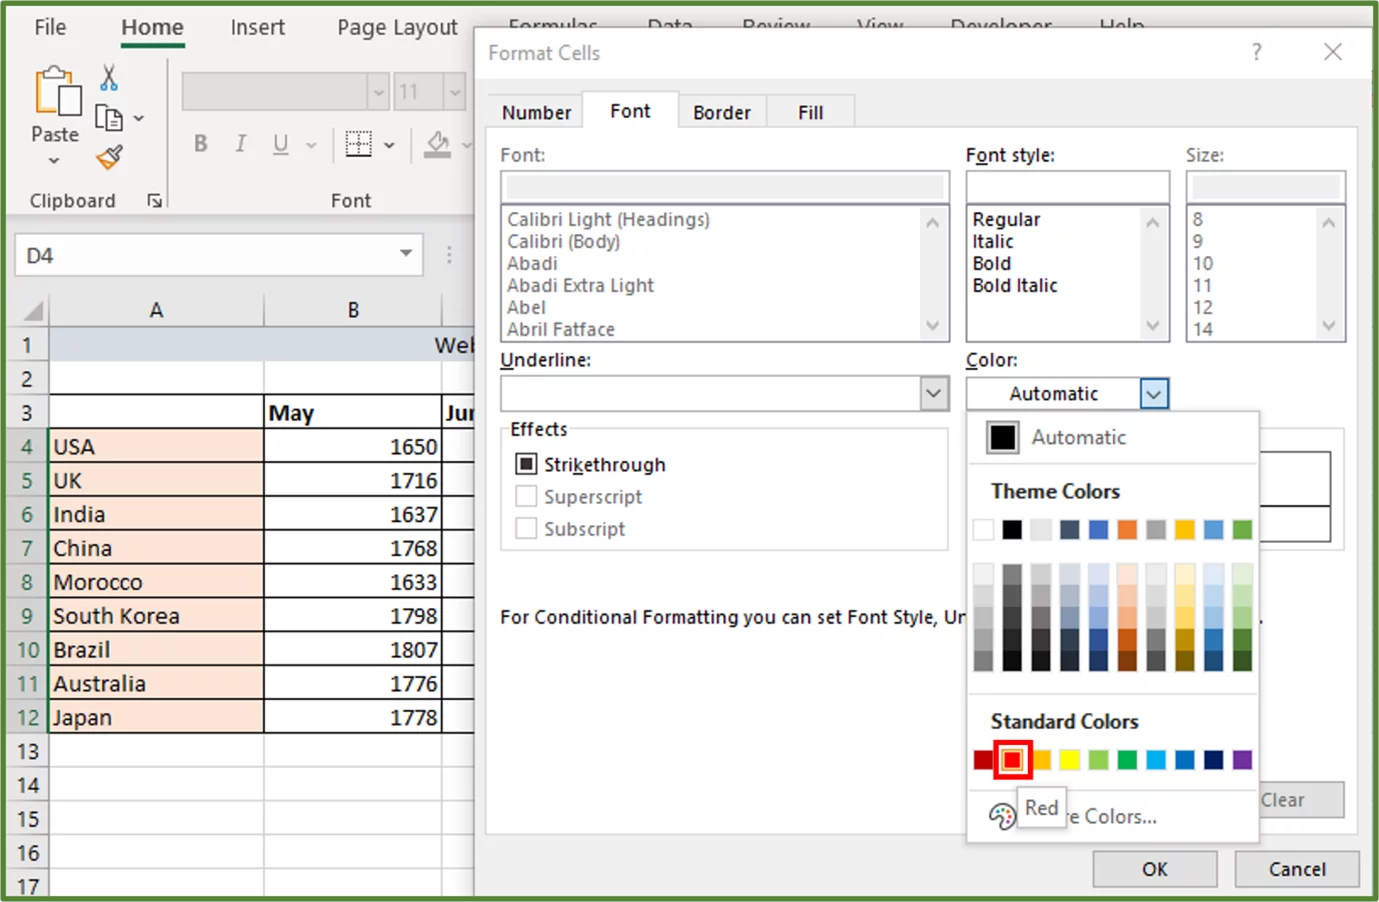
Click Ok and then Ok again. The result is the following.
To learn more about Conditional Formatting in Excel, please visit this post.
Increase or Decrease an Amount by a Percentage
You can also use Excel, to calculate what the effect of increasing/decreasing an amount by a certain percentage, is.
Increasing an Amount by a Percentage
Let’s say we have a luxury boutique selling designer bow ties. The boutique has decided to increase the price of all items by 7%. Let’s calculate what the new price of each item will be.
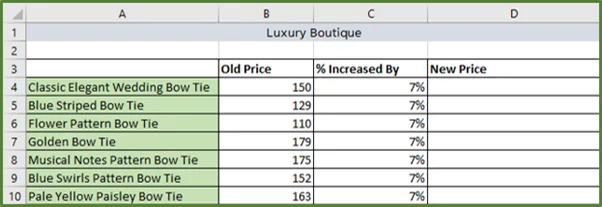
To calculate the new price we would use the following equation.

First format the range D4:D10 with the currency format and two decimal places. Then in cell D4 enter the following formula.
=B4*(1+C4).
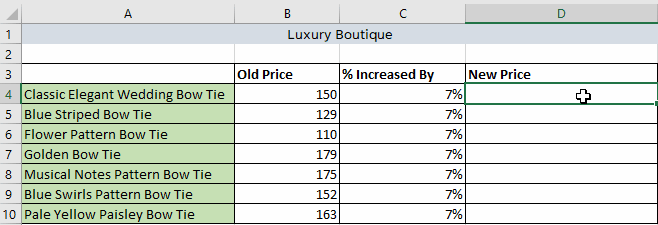
Press Enter and then double-click so that the rest of the column is populated with the formula.
Decreasing an Amount by a Percentage
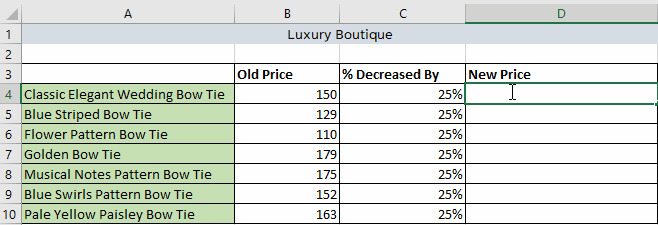
So now let’s look at the situation if the luxury boutique has a sale and decides to decrease all prices by 25%.
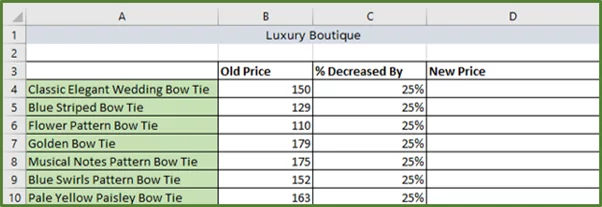
To calculate the new price we would use the following equation.

First format the range D4:D10 with the currency format and two decimal places. Then in cell D4 enter the following formula.
=B4*(1-C4).
Press Enter and then double-click so that the rest of the column is populated with the formula.
To learn more about Data Analysis in Excel, please visit this page.
Calculating a Simple Percentage in PowerPoint by Using VBA
We can also do a simple percentage calculation in PowerPoint.
Since PowerPoint doesn’t have built-in formulas and functions like Excel, we will use VBA to do this.
Adding the Developer Tab
So the first thing we have to do is open PowerPoint. Create a new Blank Presentation. Go to the File Tab and then choose Options.
Go to Customize Ribbon and in the Main Tabs section, check the Developer Tab.
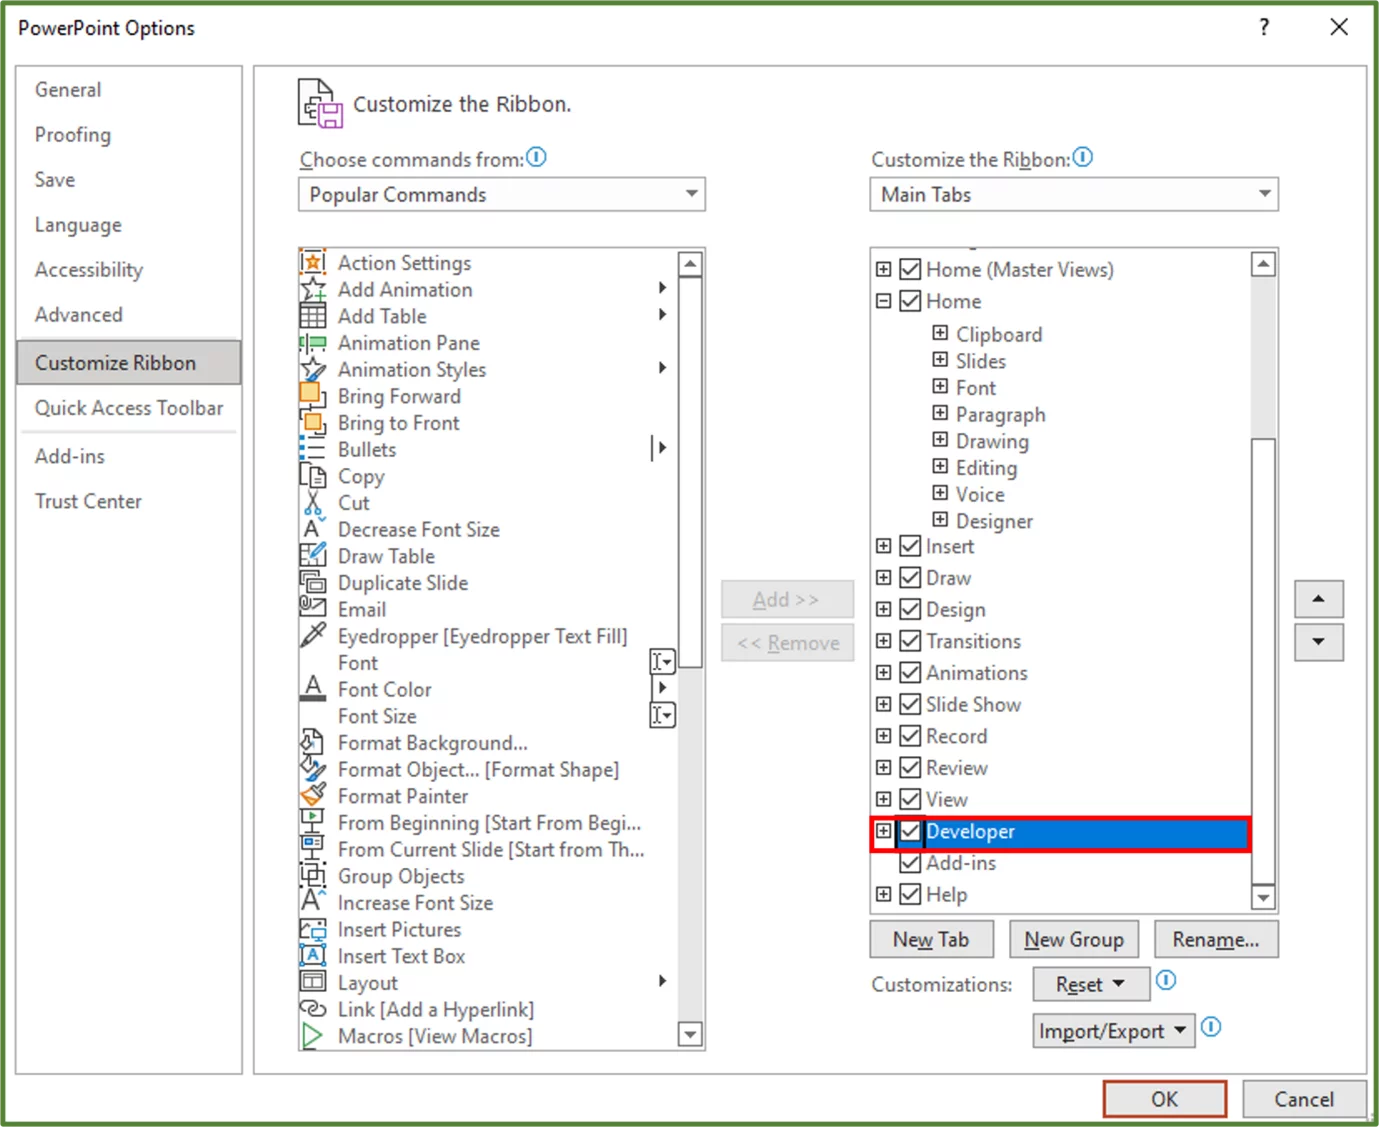
Click Ok.
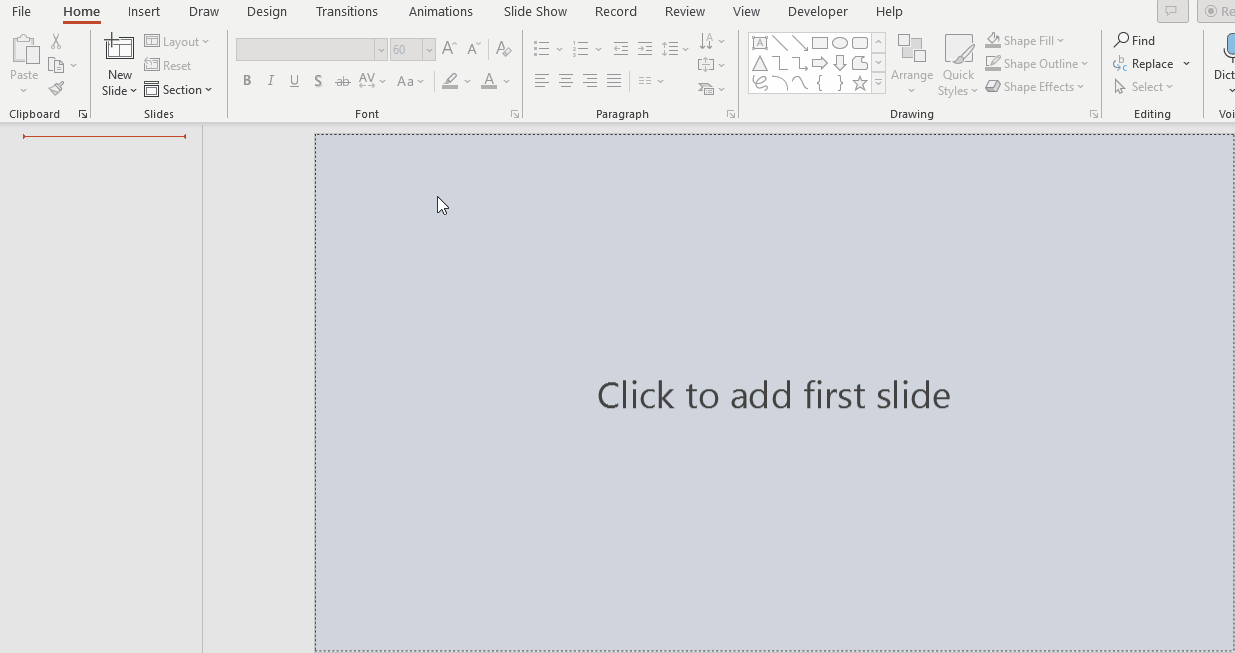
Inserting a Blank Slide
Delete the existing first slide and then go to the Home Tab and in the Slides Group, click on the New Slide option.
Select Blank.
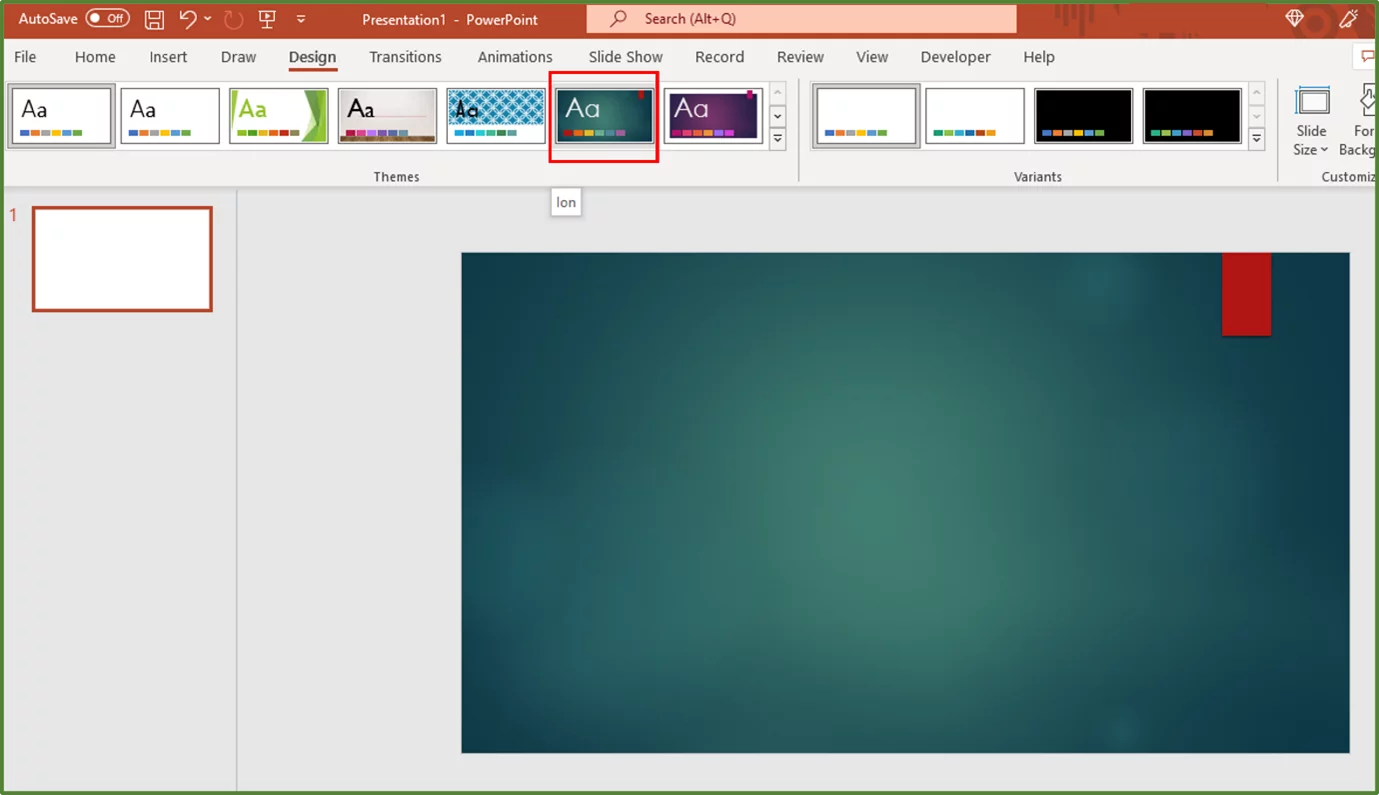
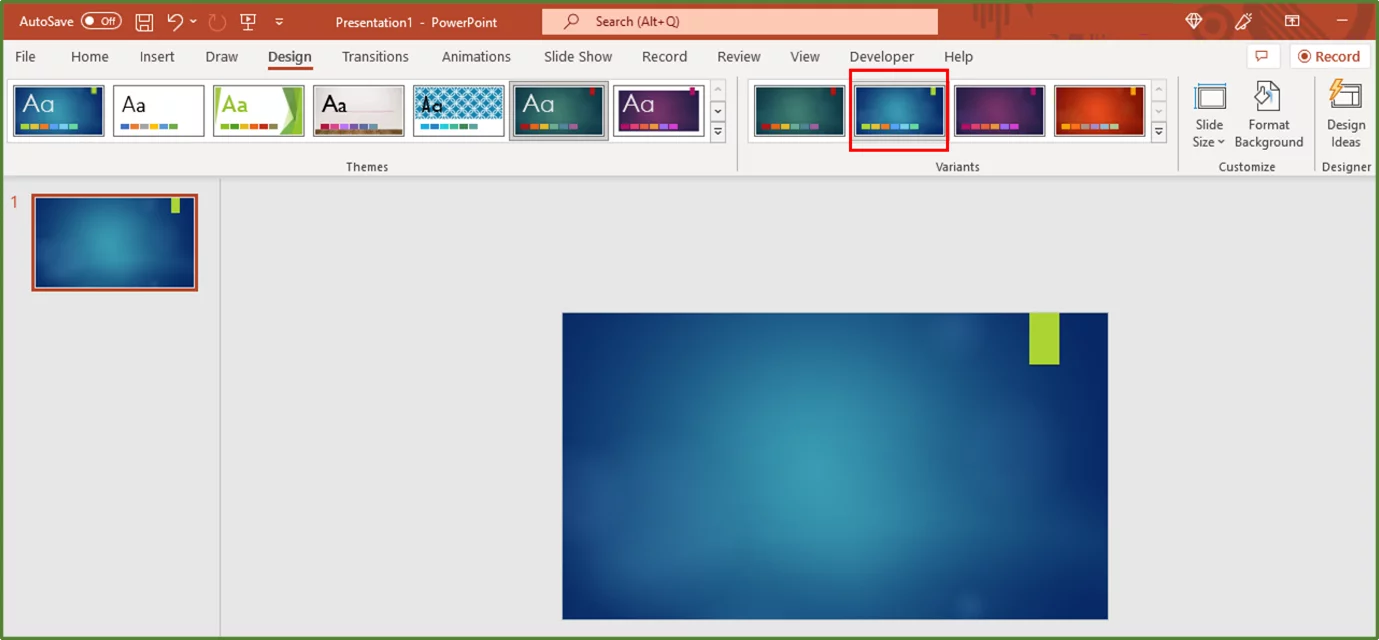
Changing the Theme and Variant
Now go to the Design Tab and in the Themes Group, choose Ion.
While still in the Design Tab, in the Variants Group, select the following variant.
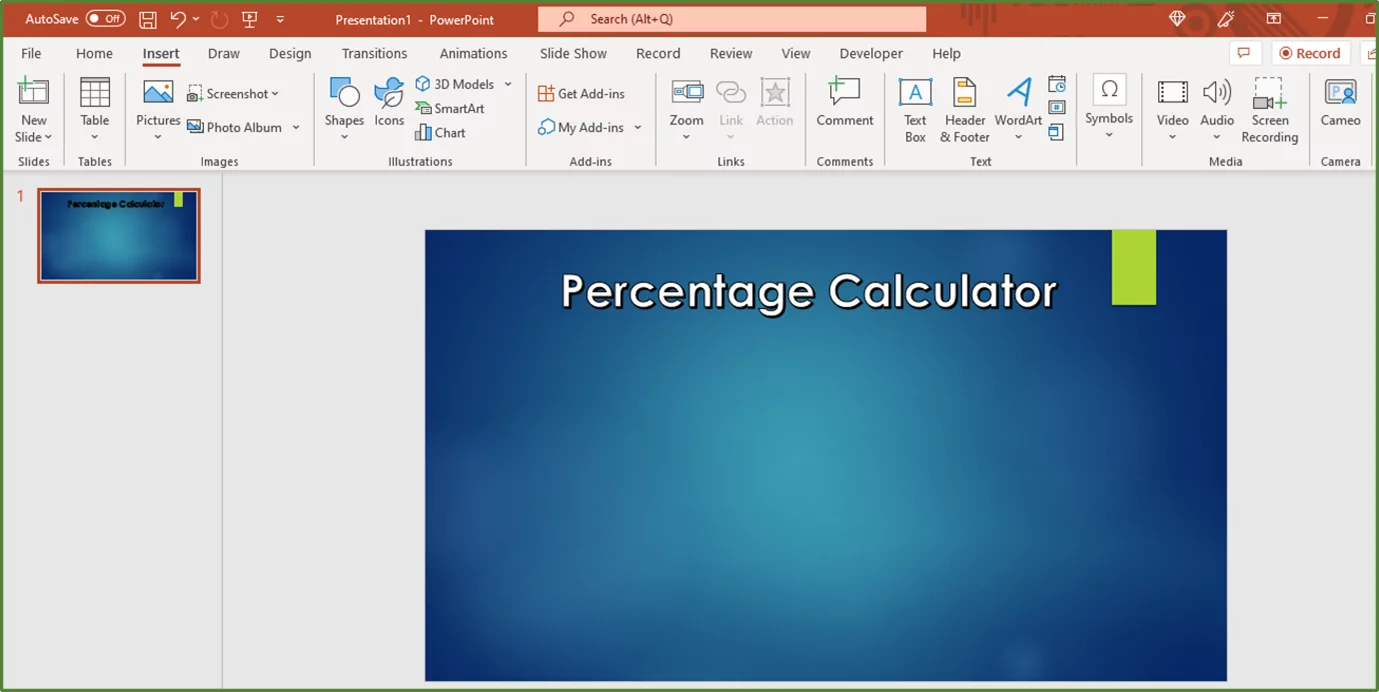
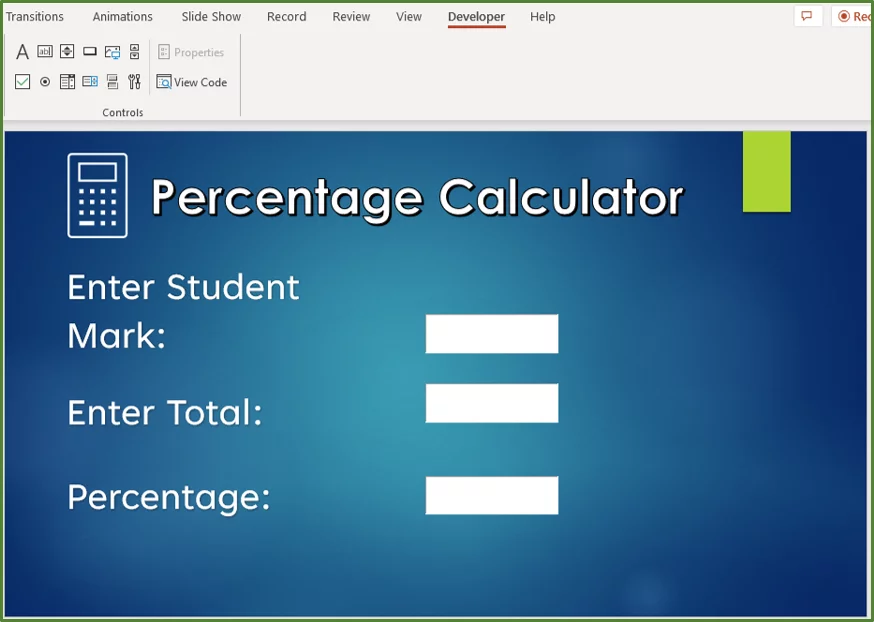
Adding the Heading
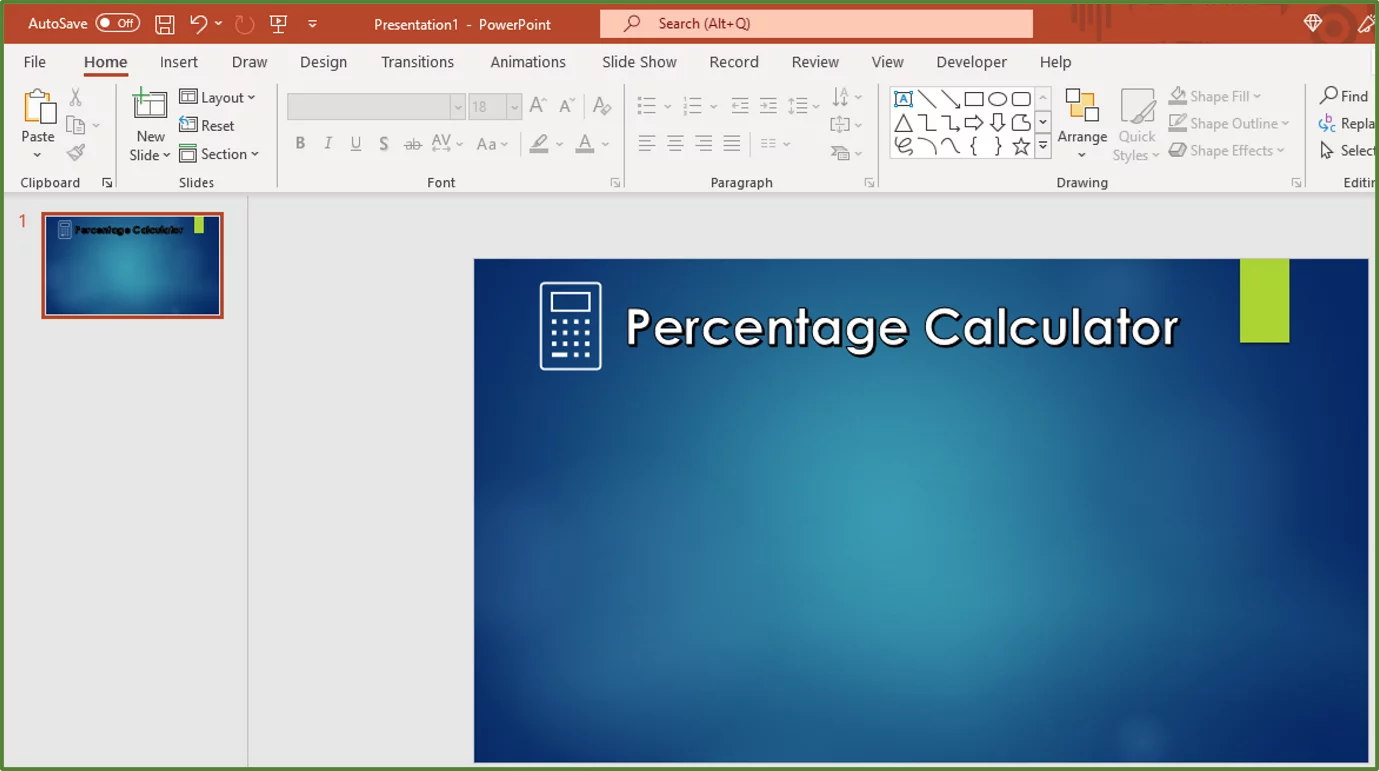
Now go to the Insert Tab, and in the Text Group, select the WordArt option.
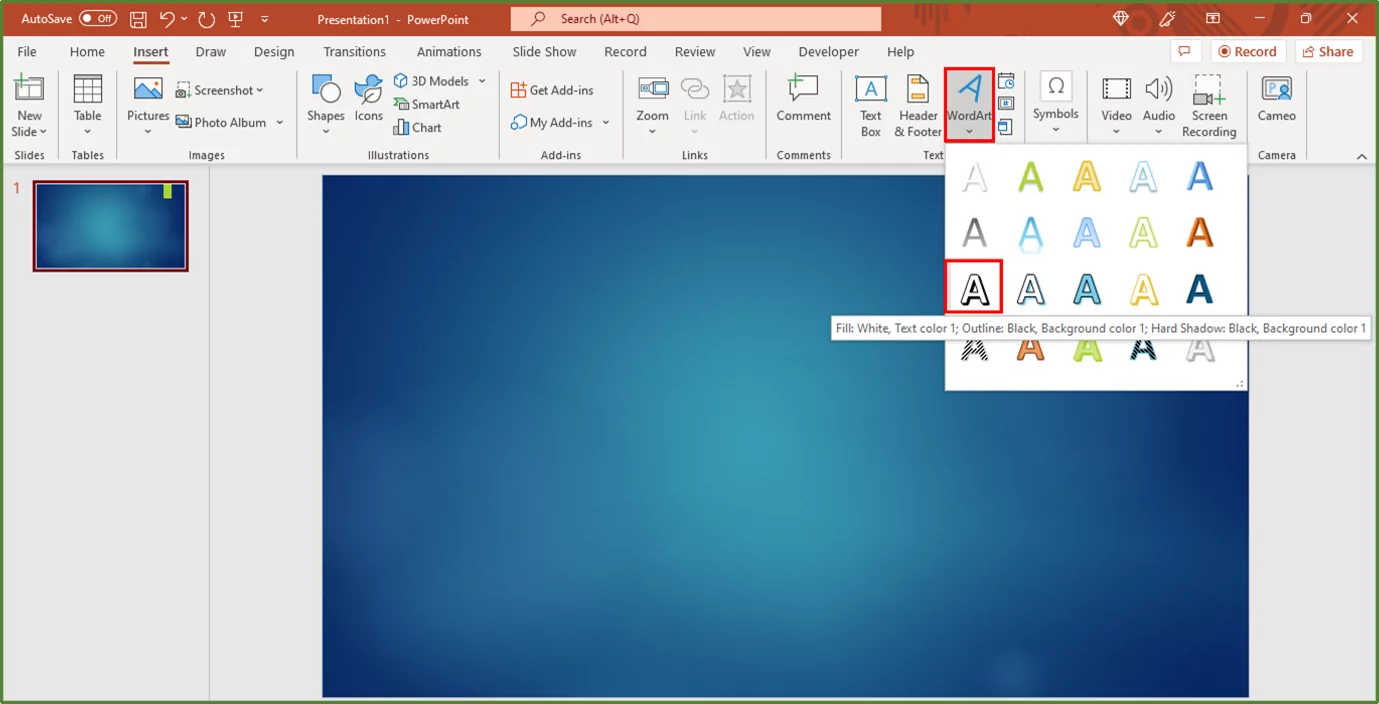
Enter the text Percentage Calculator.
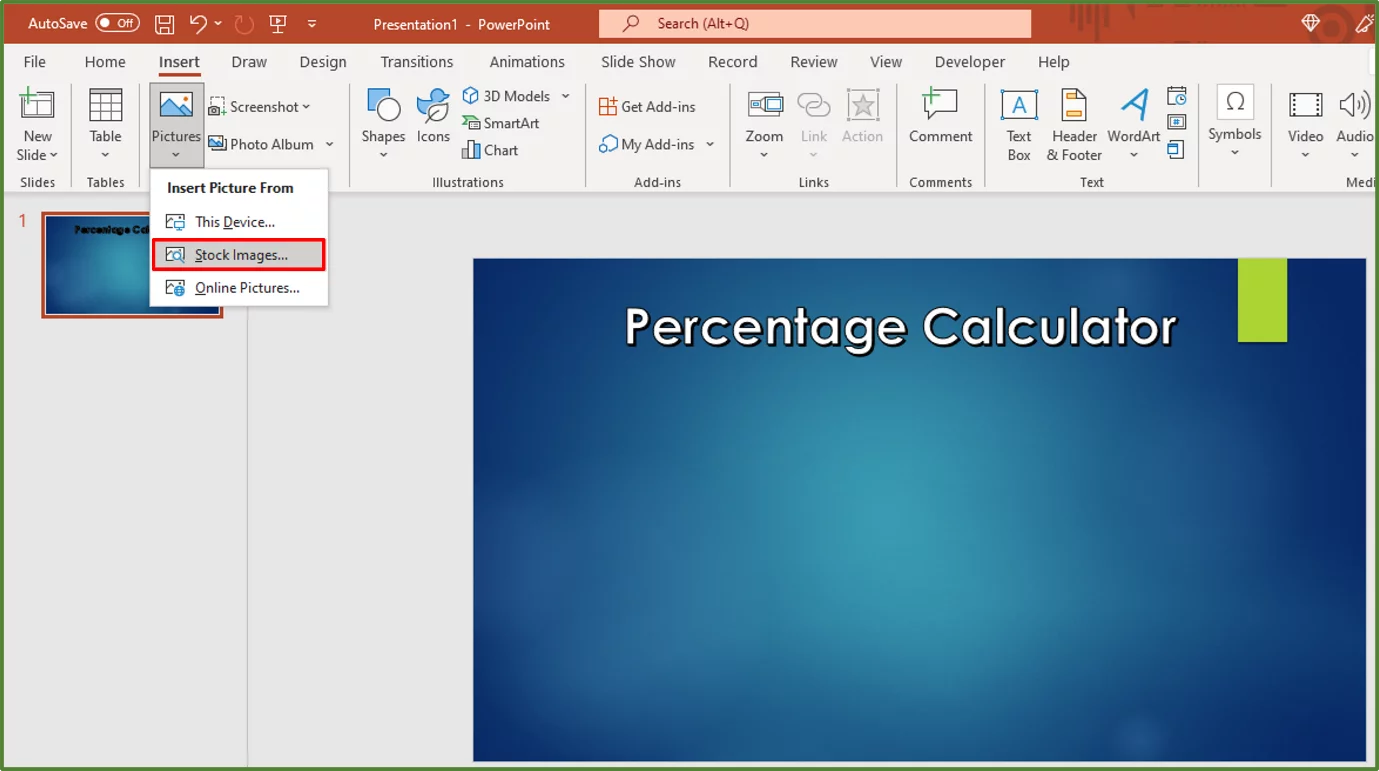
Inserting an Image
Now while still in the Insert Tab, go to the Images Group. Select the Pictures option. Choose Stock Images…
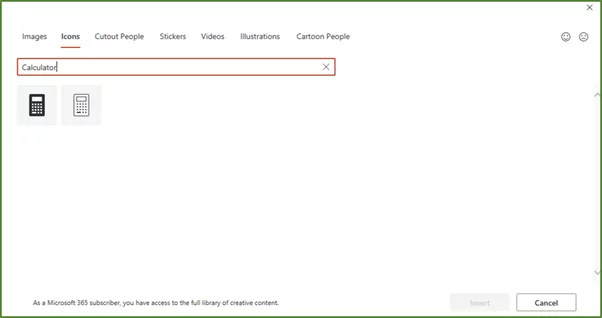
Select the Icons Tab, and then enter Calculator in the Search Box.
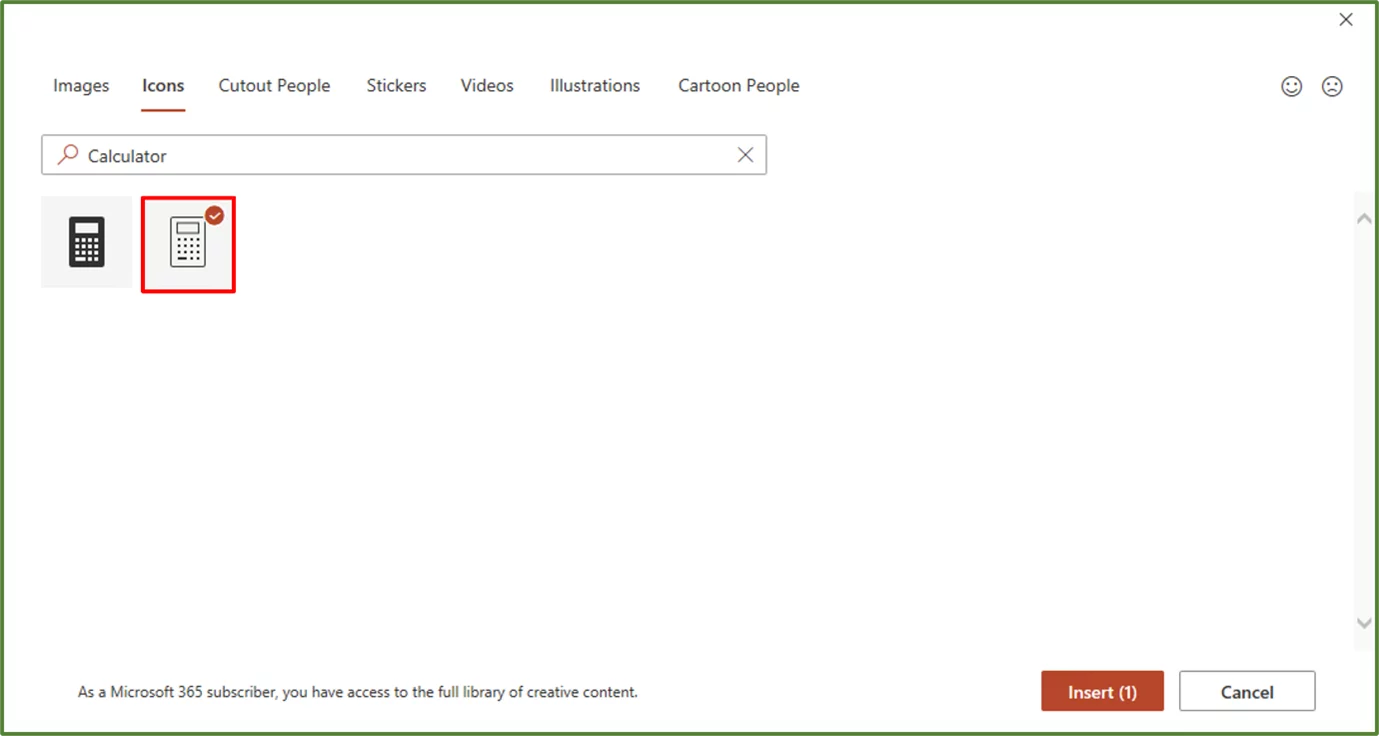
Select the following image and click Insert.
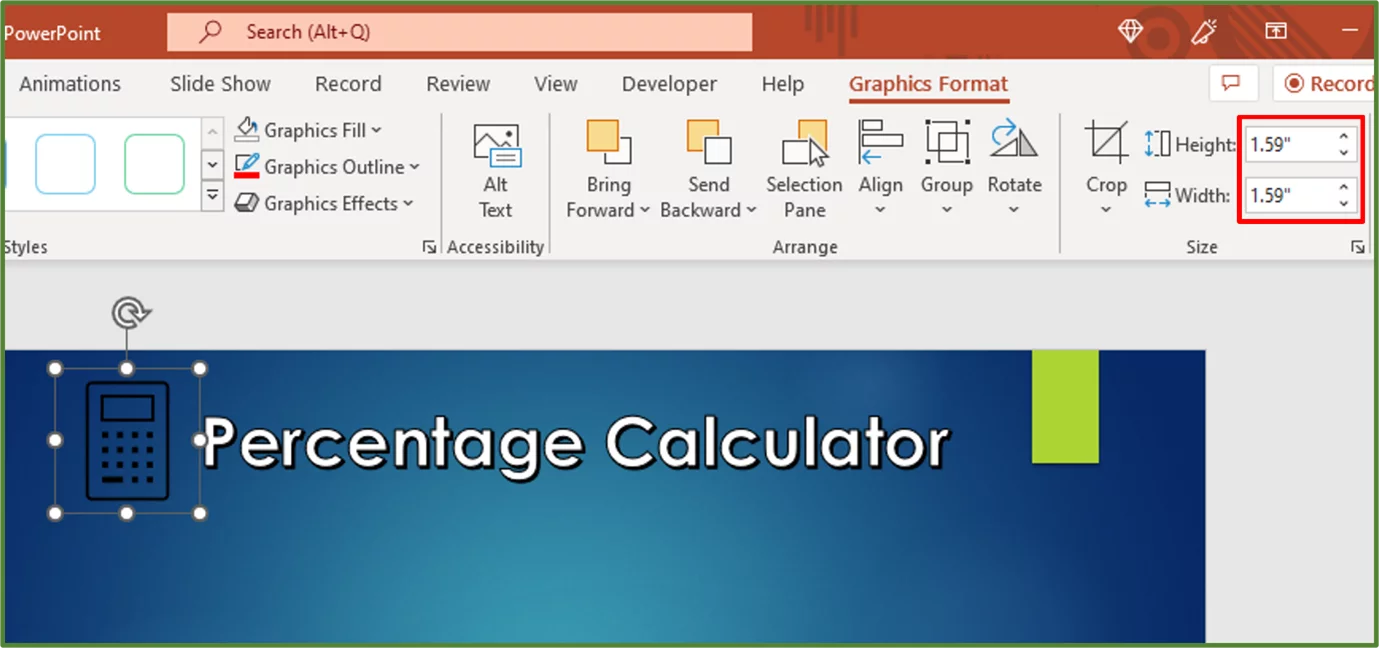
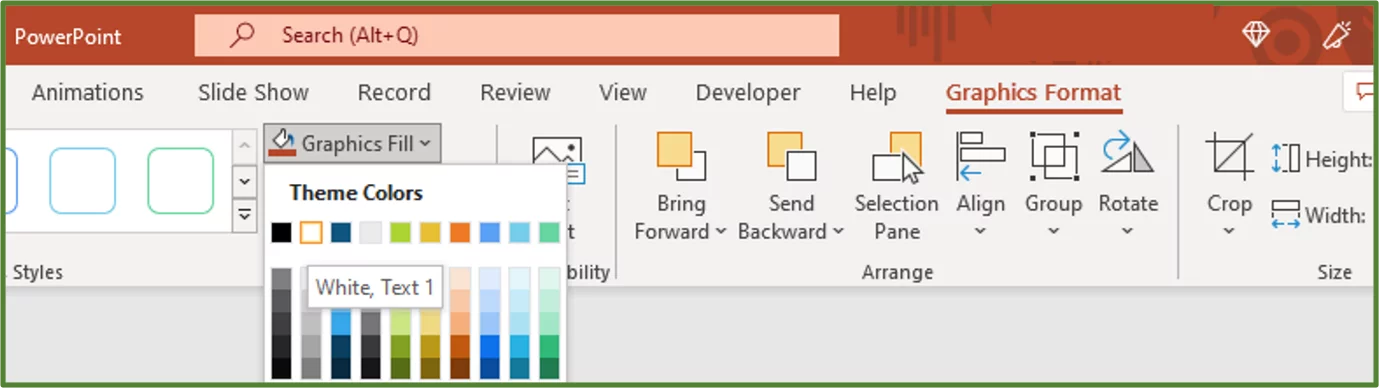
With the image selected, go to the Graphics Format Tab. In the Size Tab, resize the image to 1.59” by 1.59”.
With the image still selected, in the Graphics Format Tab, go to the Graphics Styles Group. In the Graphics Fill option, choose White, Text 1.
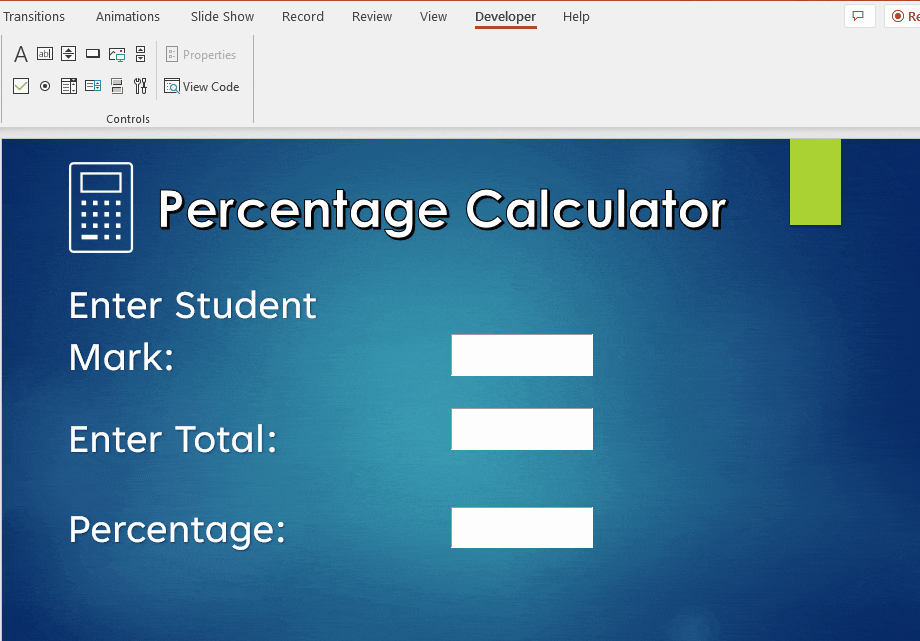
The result is the following.
Adding the Explanatory Text
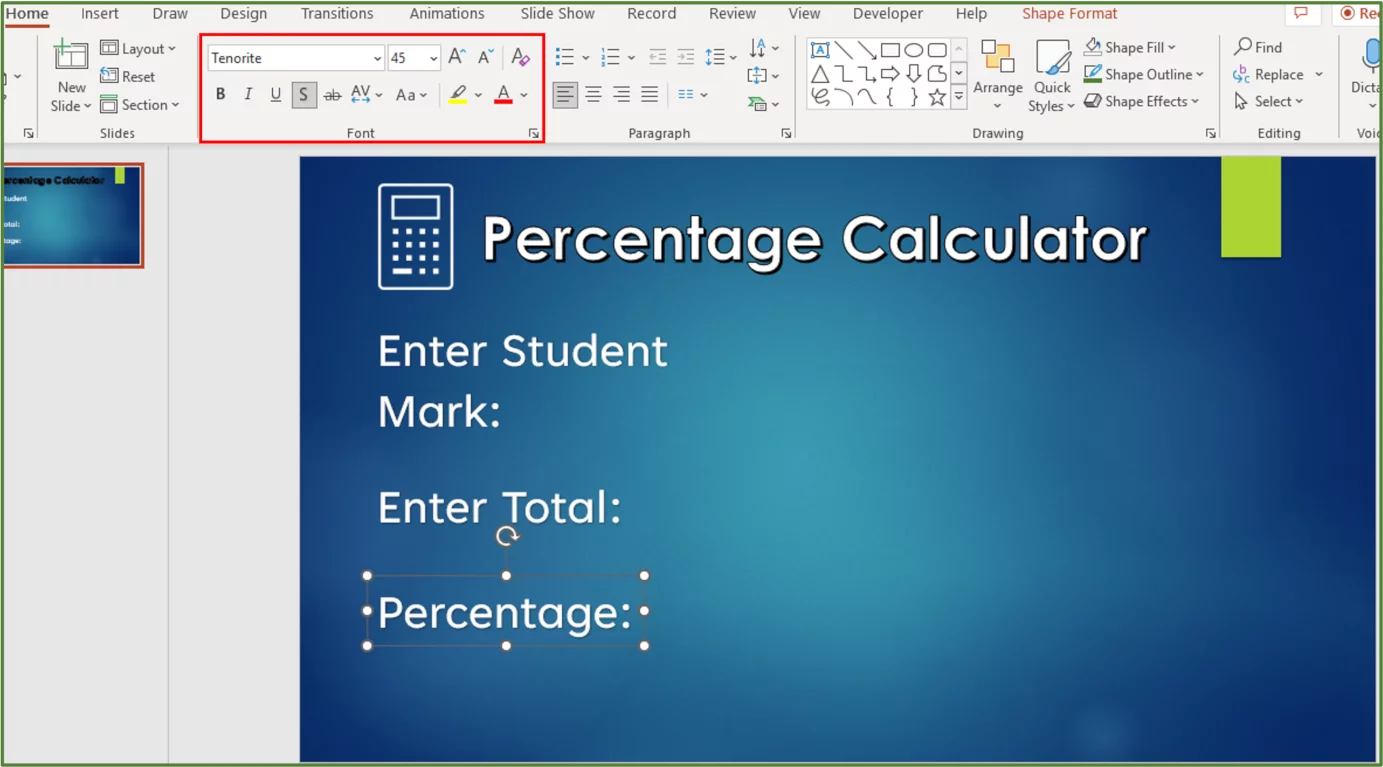
Go to the Insert Tab, and in the Text Group, select Text Box. Draw a Text Box on the slide.
Type the text Enter Student Mark: and set the font to Tenorite, the size to 45 and ensure the text has a shadow. Left-align the text.
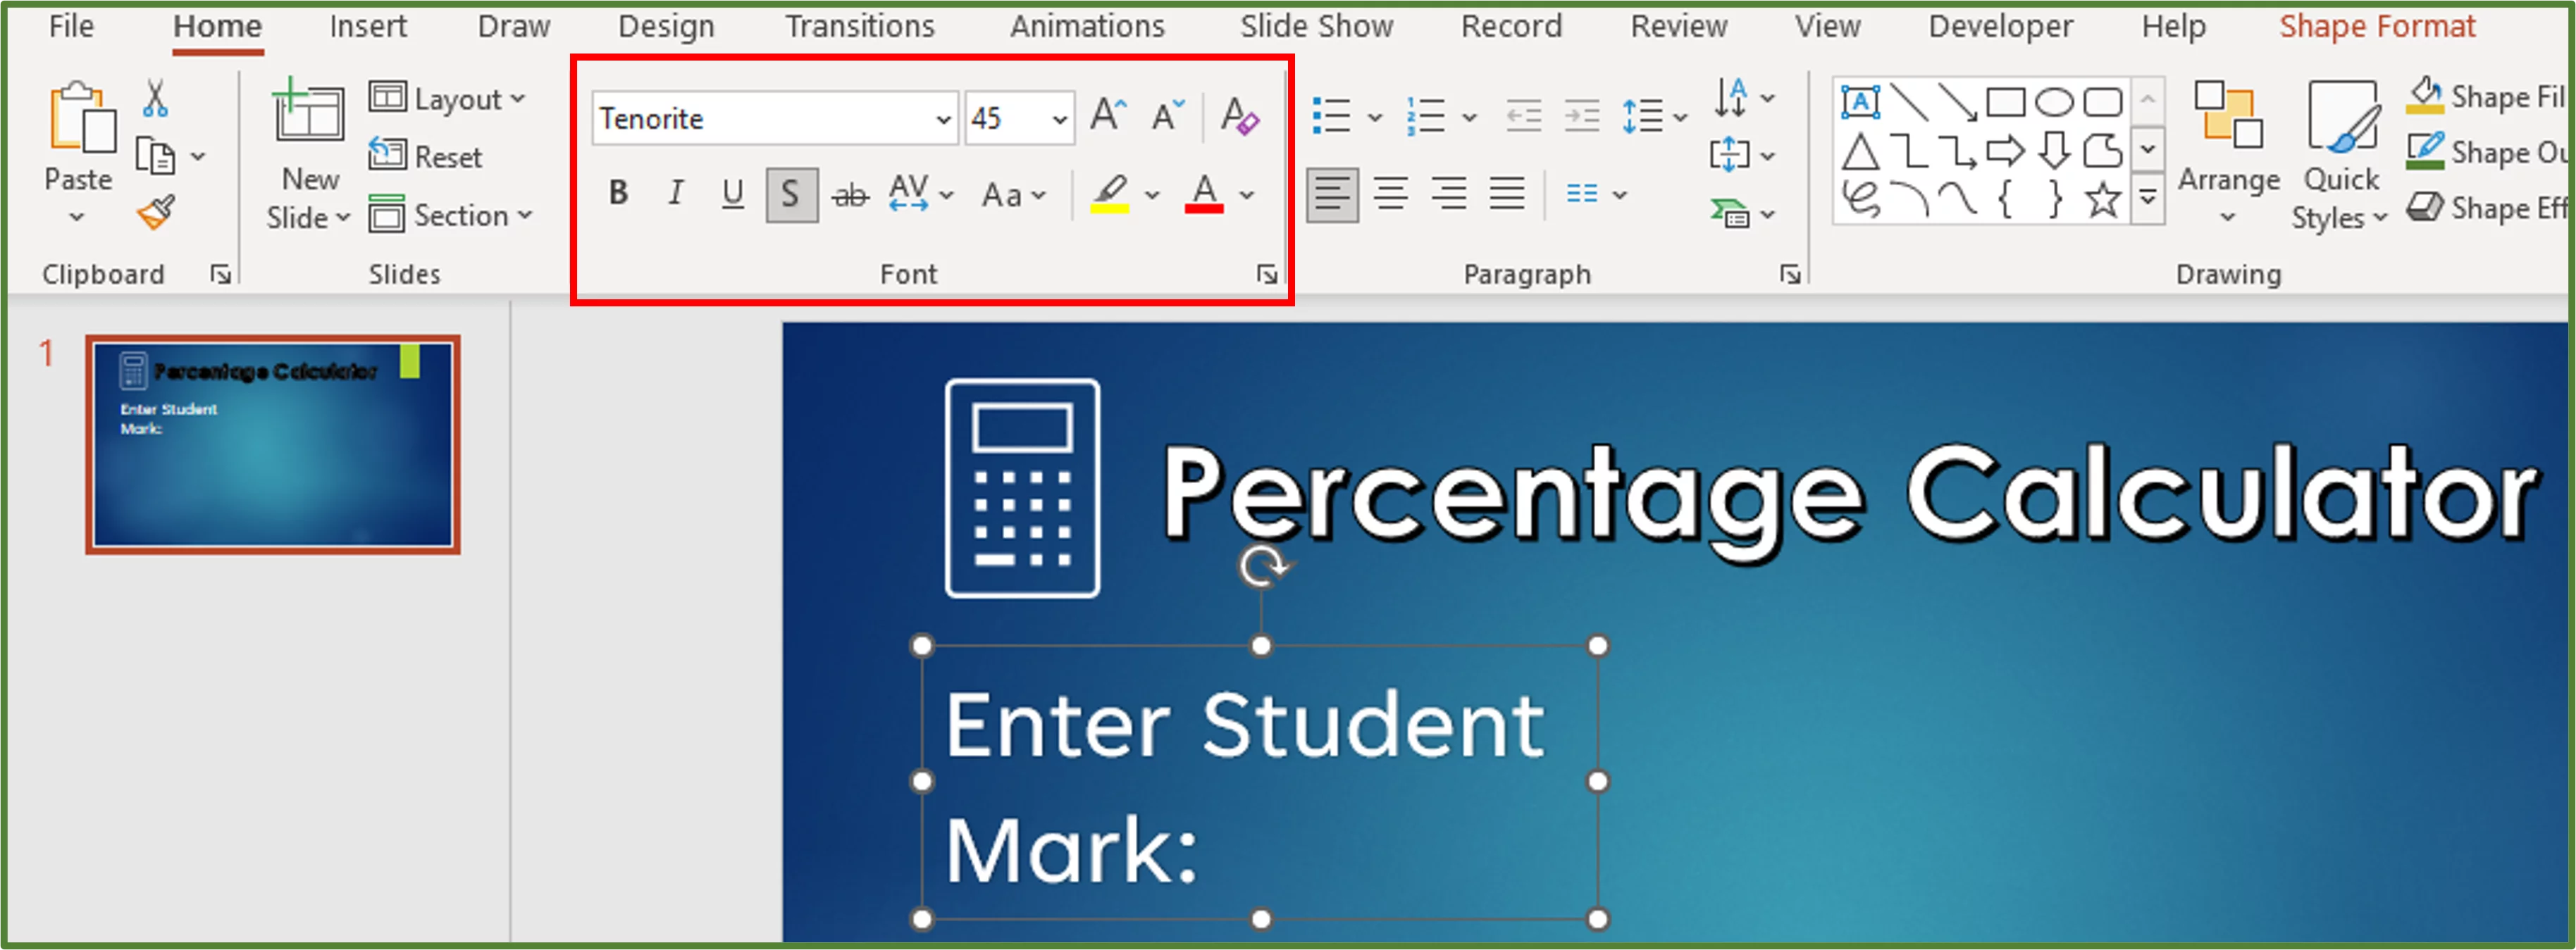
Go to the Insert Tab, and in the Text Group, select Text Box. Draw a Text Box on the slide.
Type the text Enter Total: and set the font to Tenorite, the size to 45 and ensure the text has a shadow. Left-align the text.
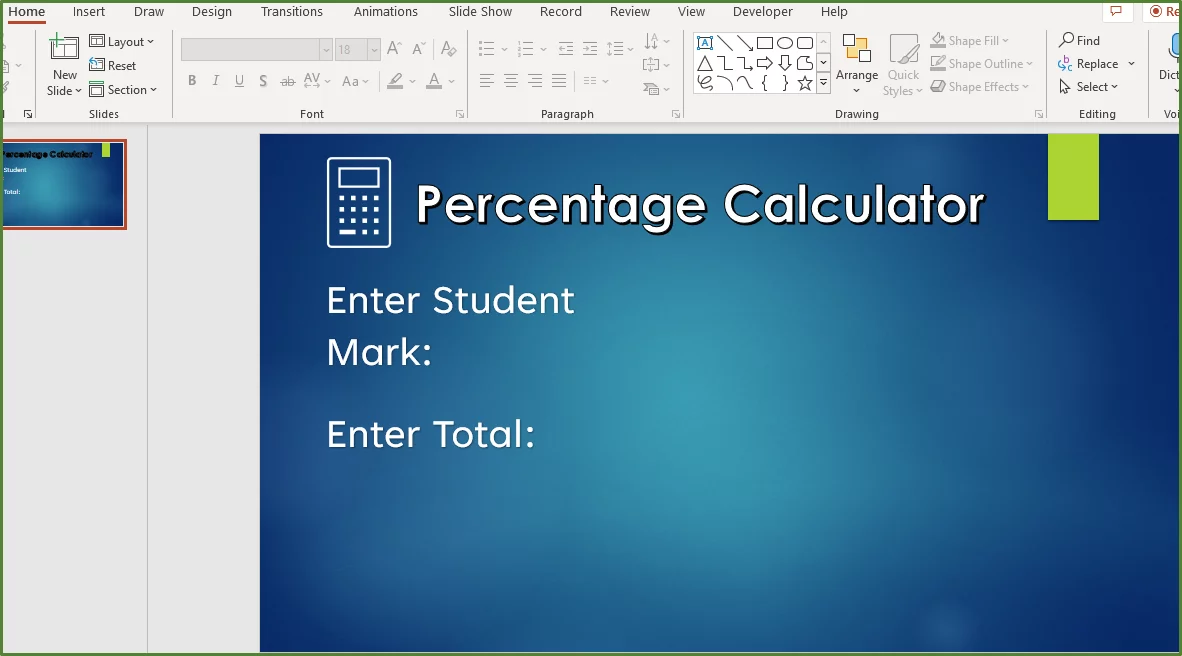
Go to the Insert Tab, and in the Text Group, select Text Box. Draw a Text Box on the slide.
Type the text Percentage: and set the font to Tenorite, the size to 45 and ensure the text has a shadow. Left-align the text.
Adding the ActiveX Control Textboxes
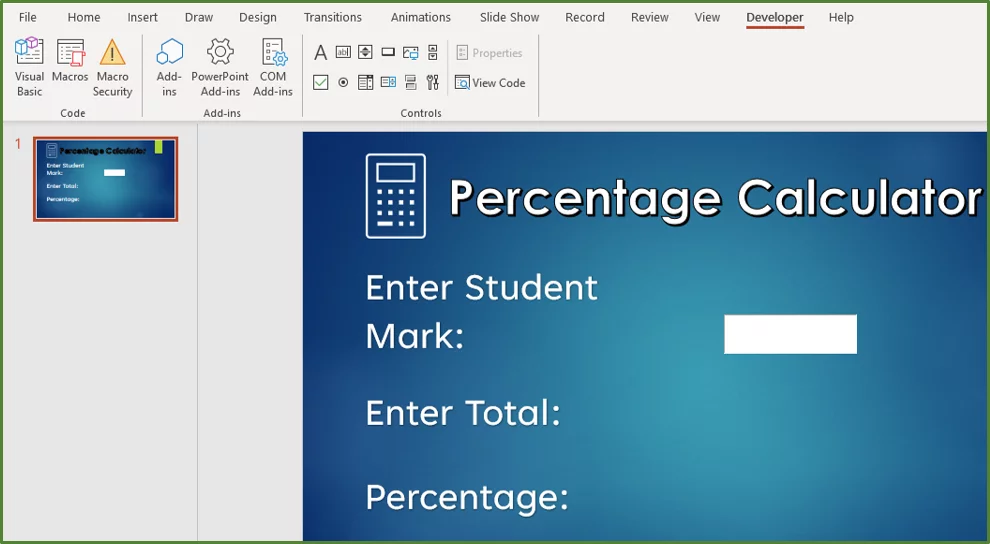
Go to the Developer Tab, and in the Controls Group, click Text Box.
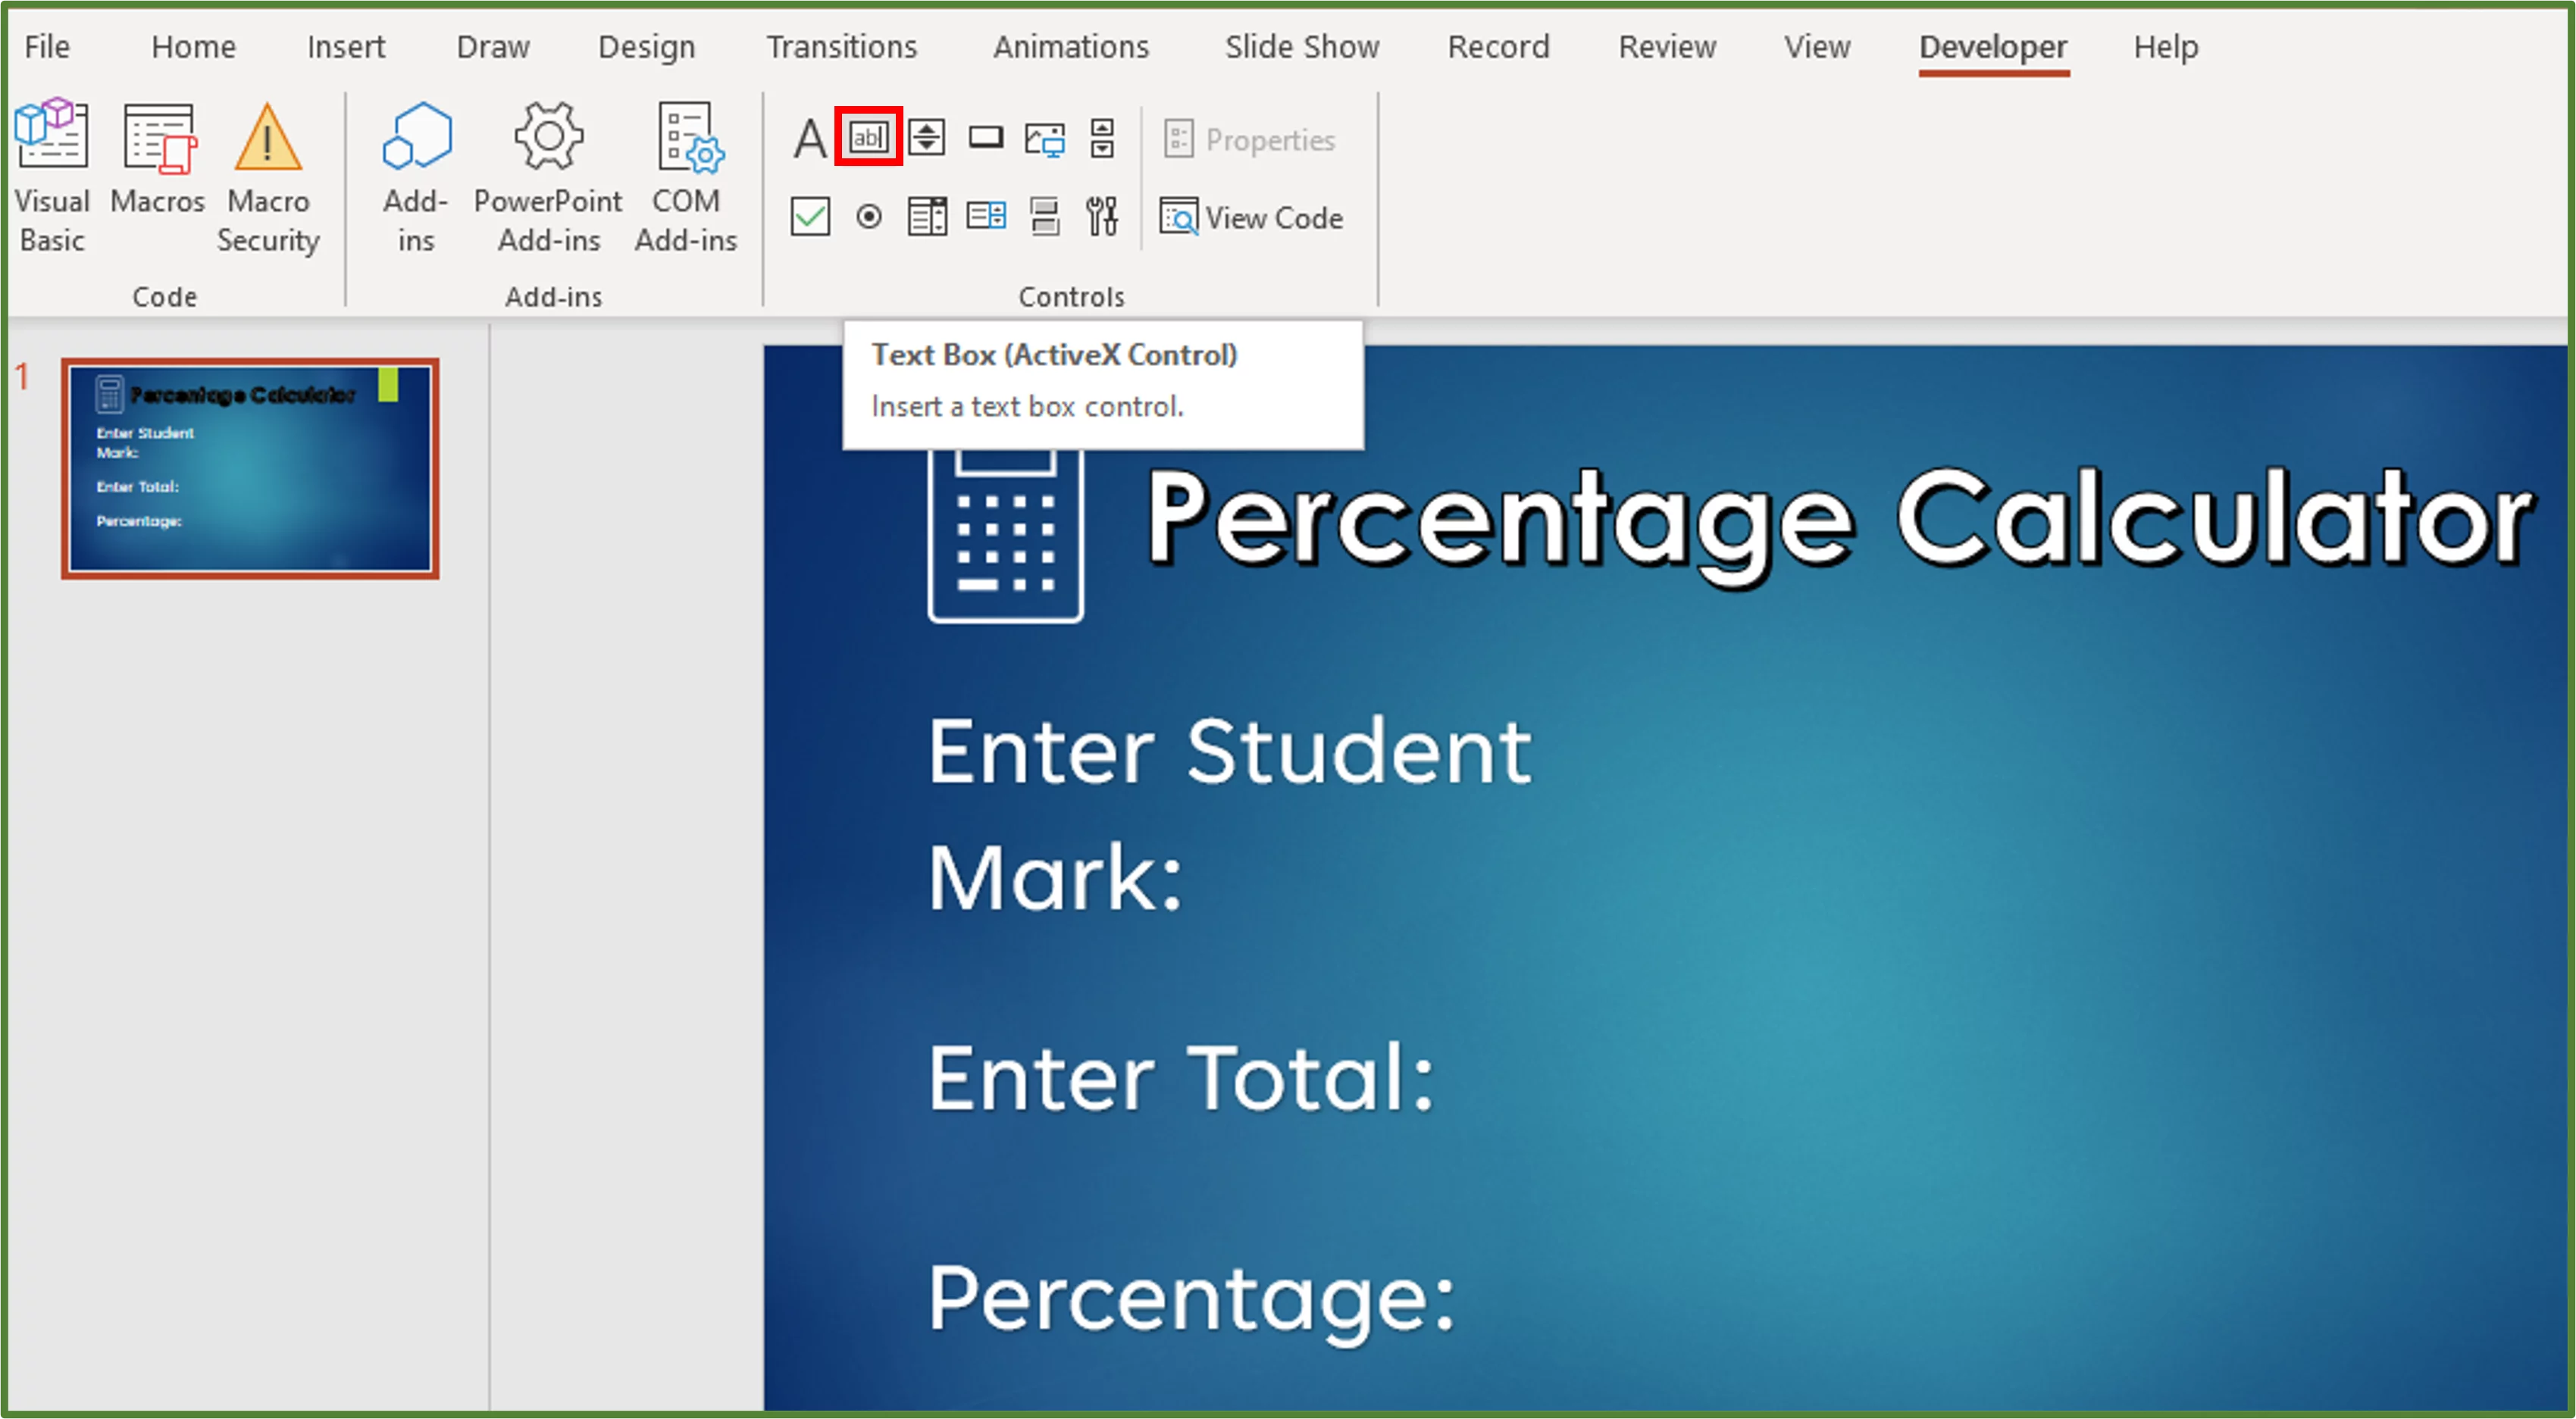
Draw a Text box on the slide as shown below.
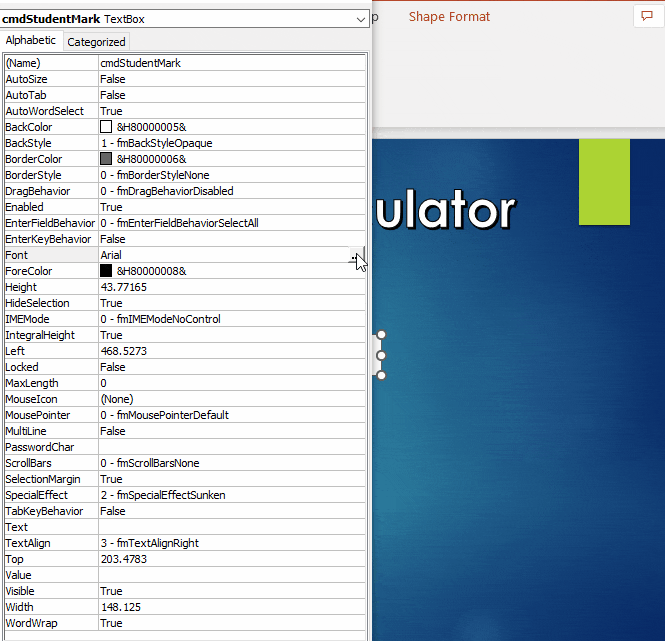
Select the Text Box by clicking on it. While still in the Developer Tab, go to the Controls Group. Select Properties.
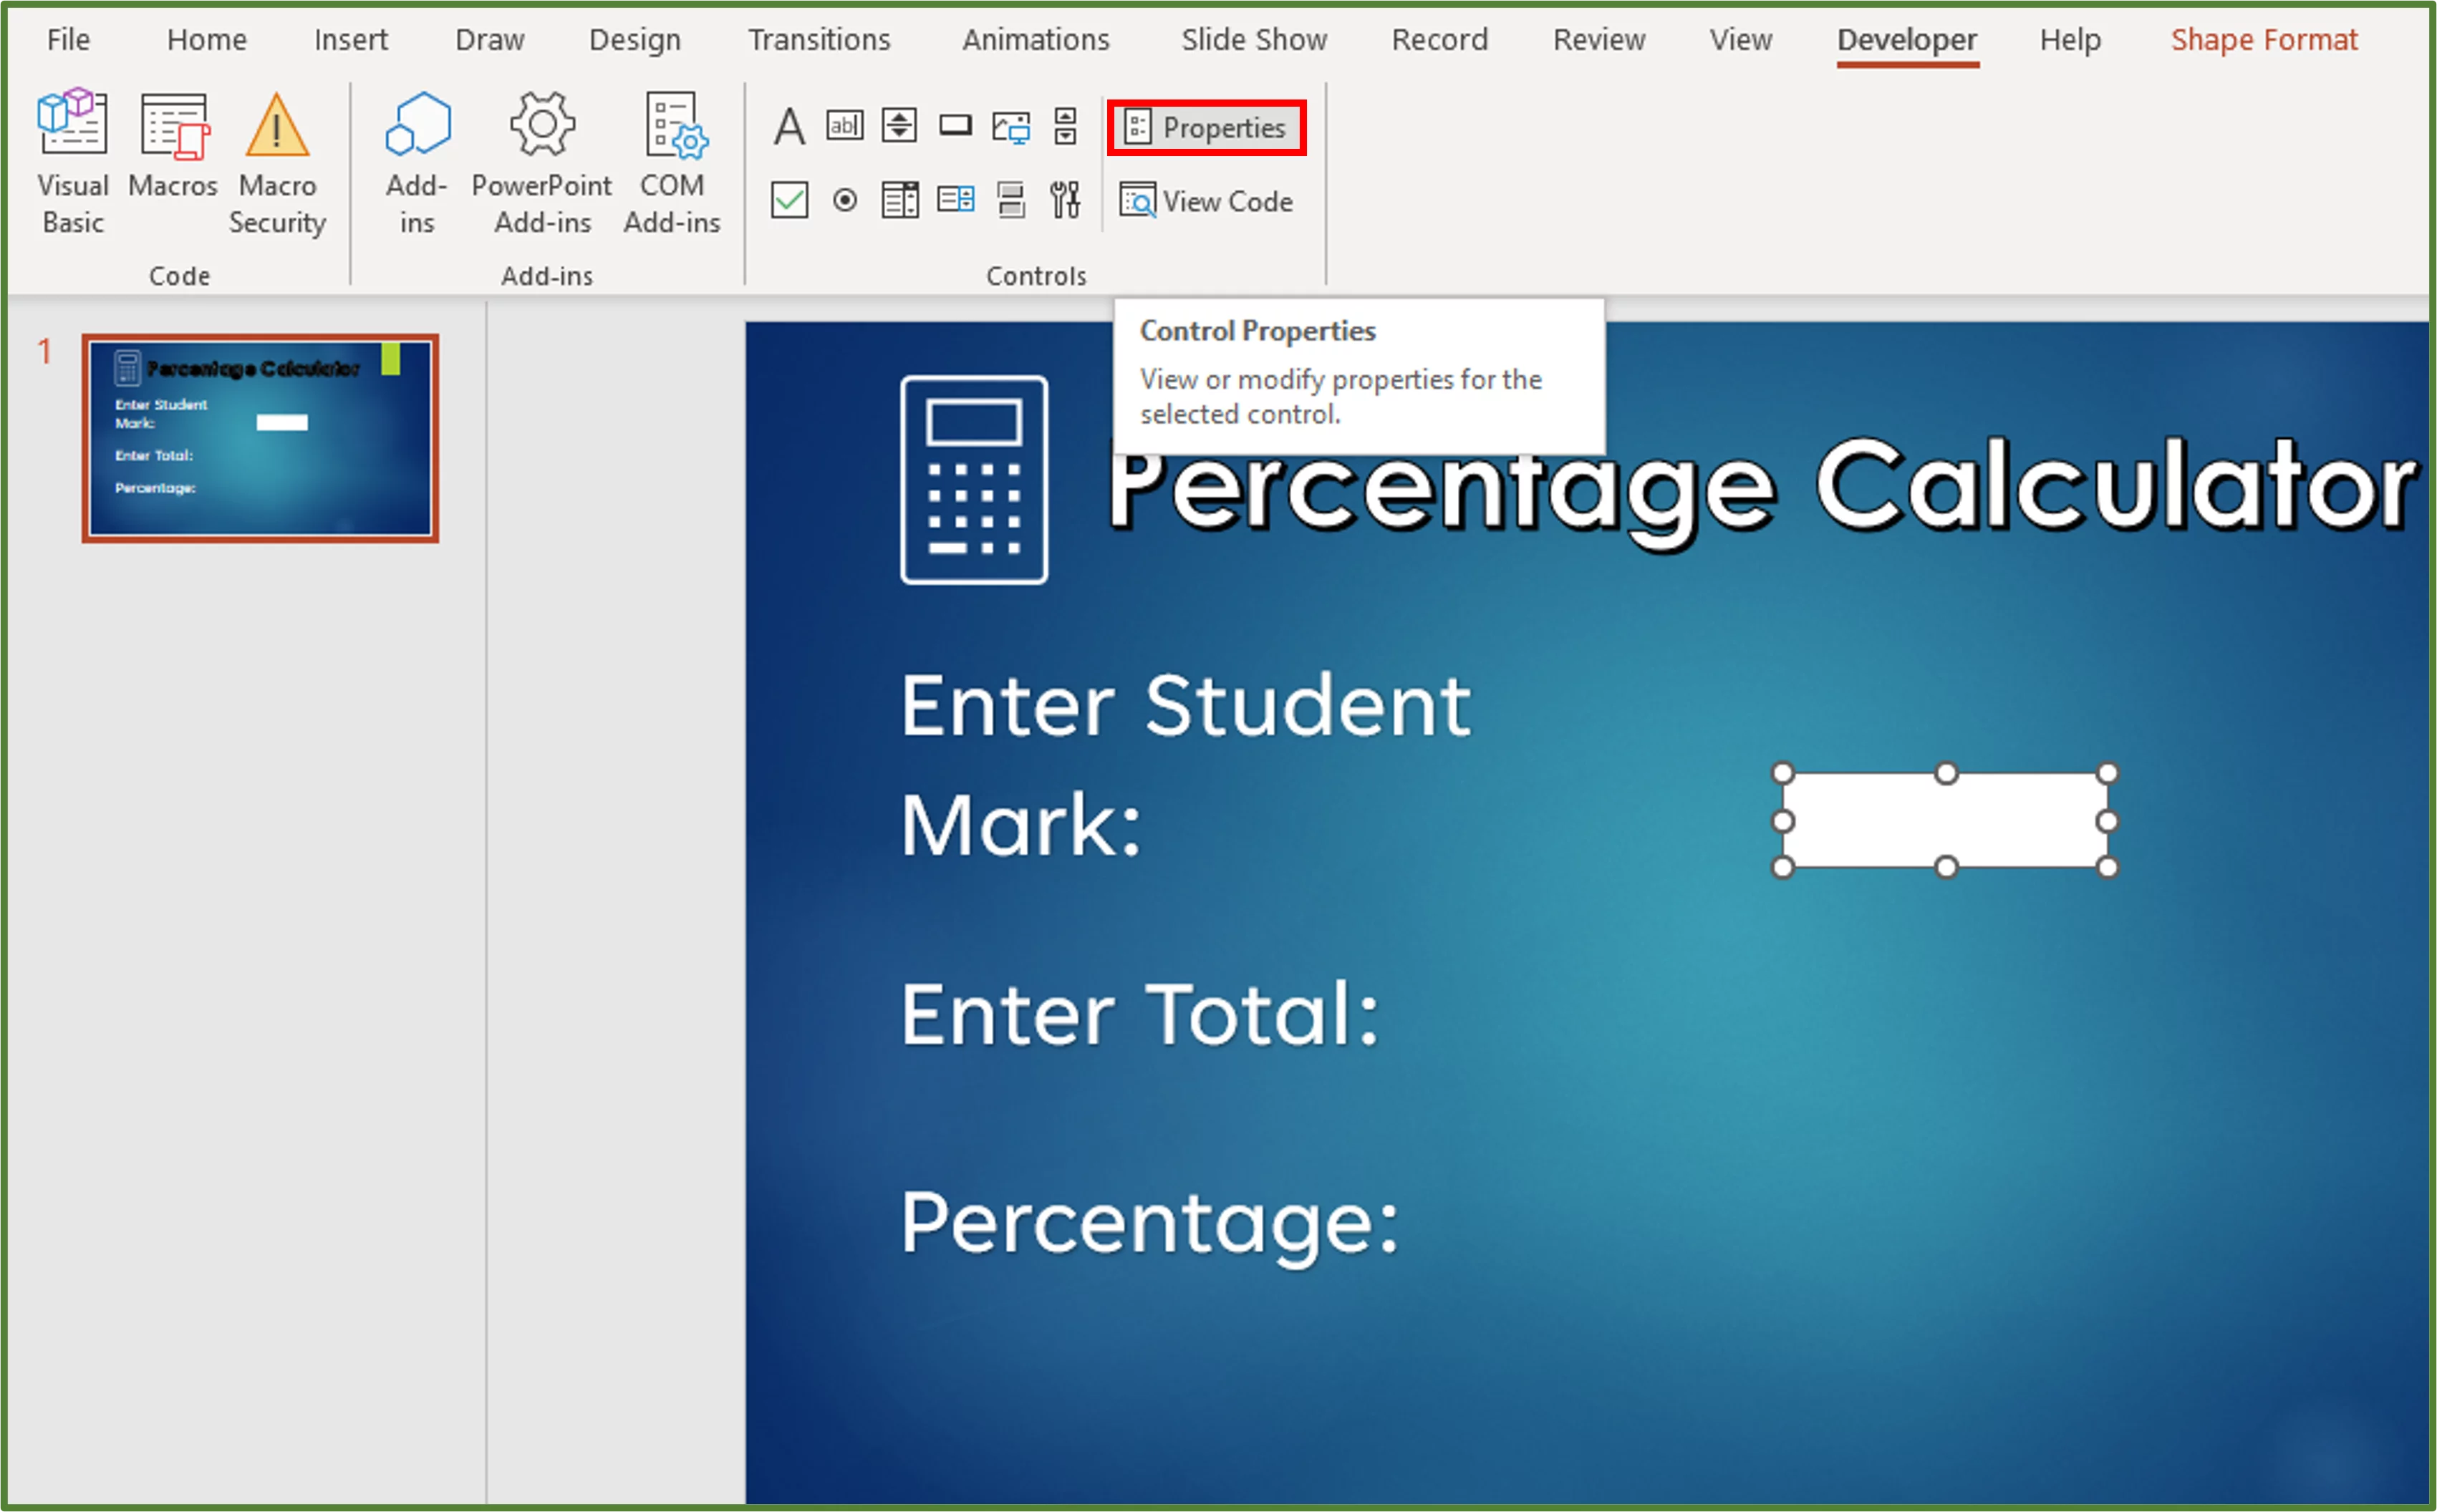
Change the name of the Text Box to cmdStudentMark. Also change the TextAlign property from Left Align to Right Align.
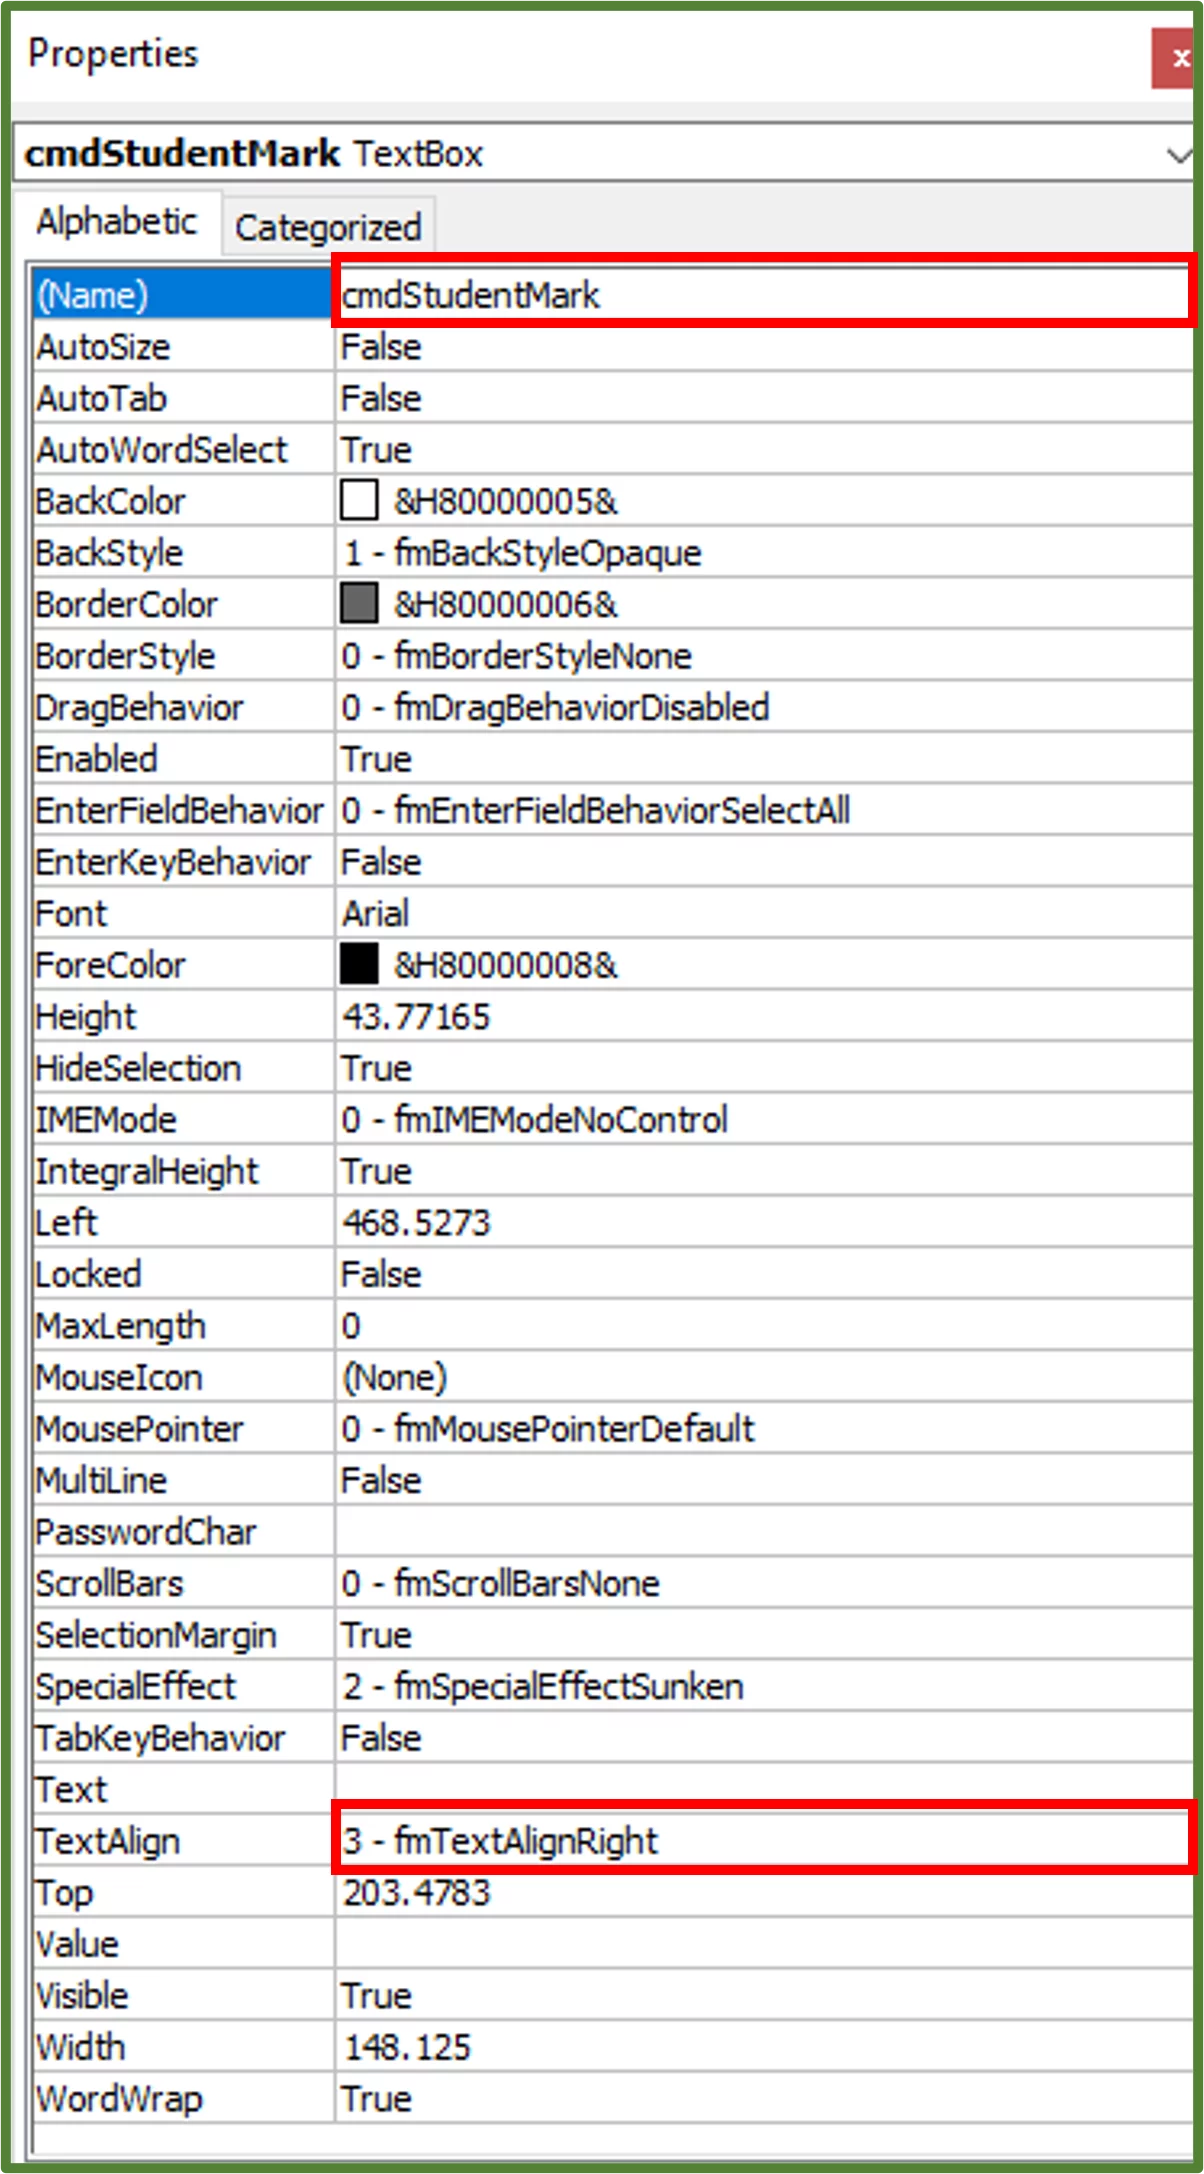
Now click on the Font option by clicking on the three dots. Change the font from Arial to Tenorite and set the font size to 24. Click Ok. Close the Properties Window.
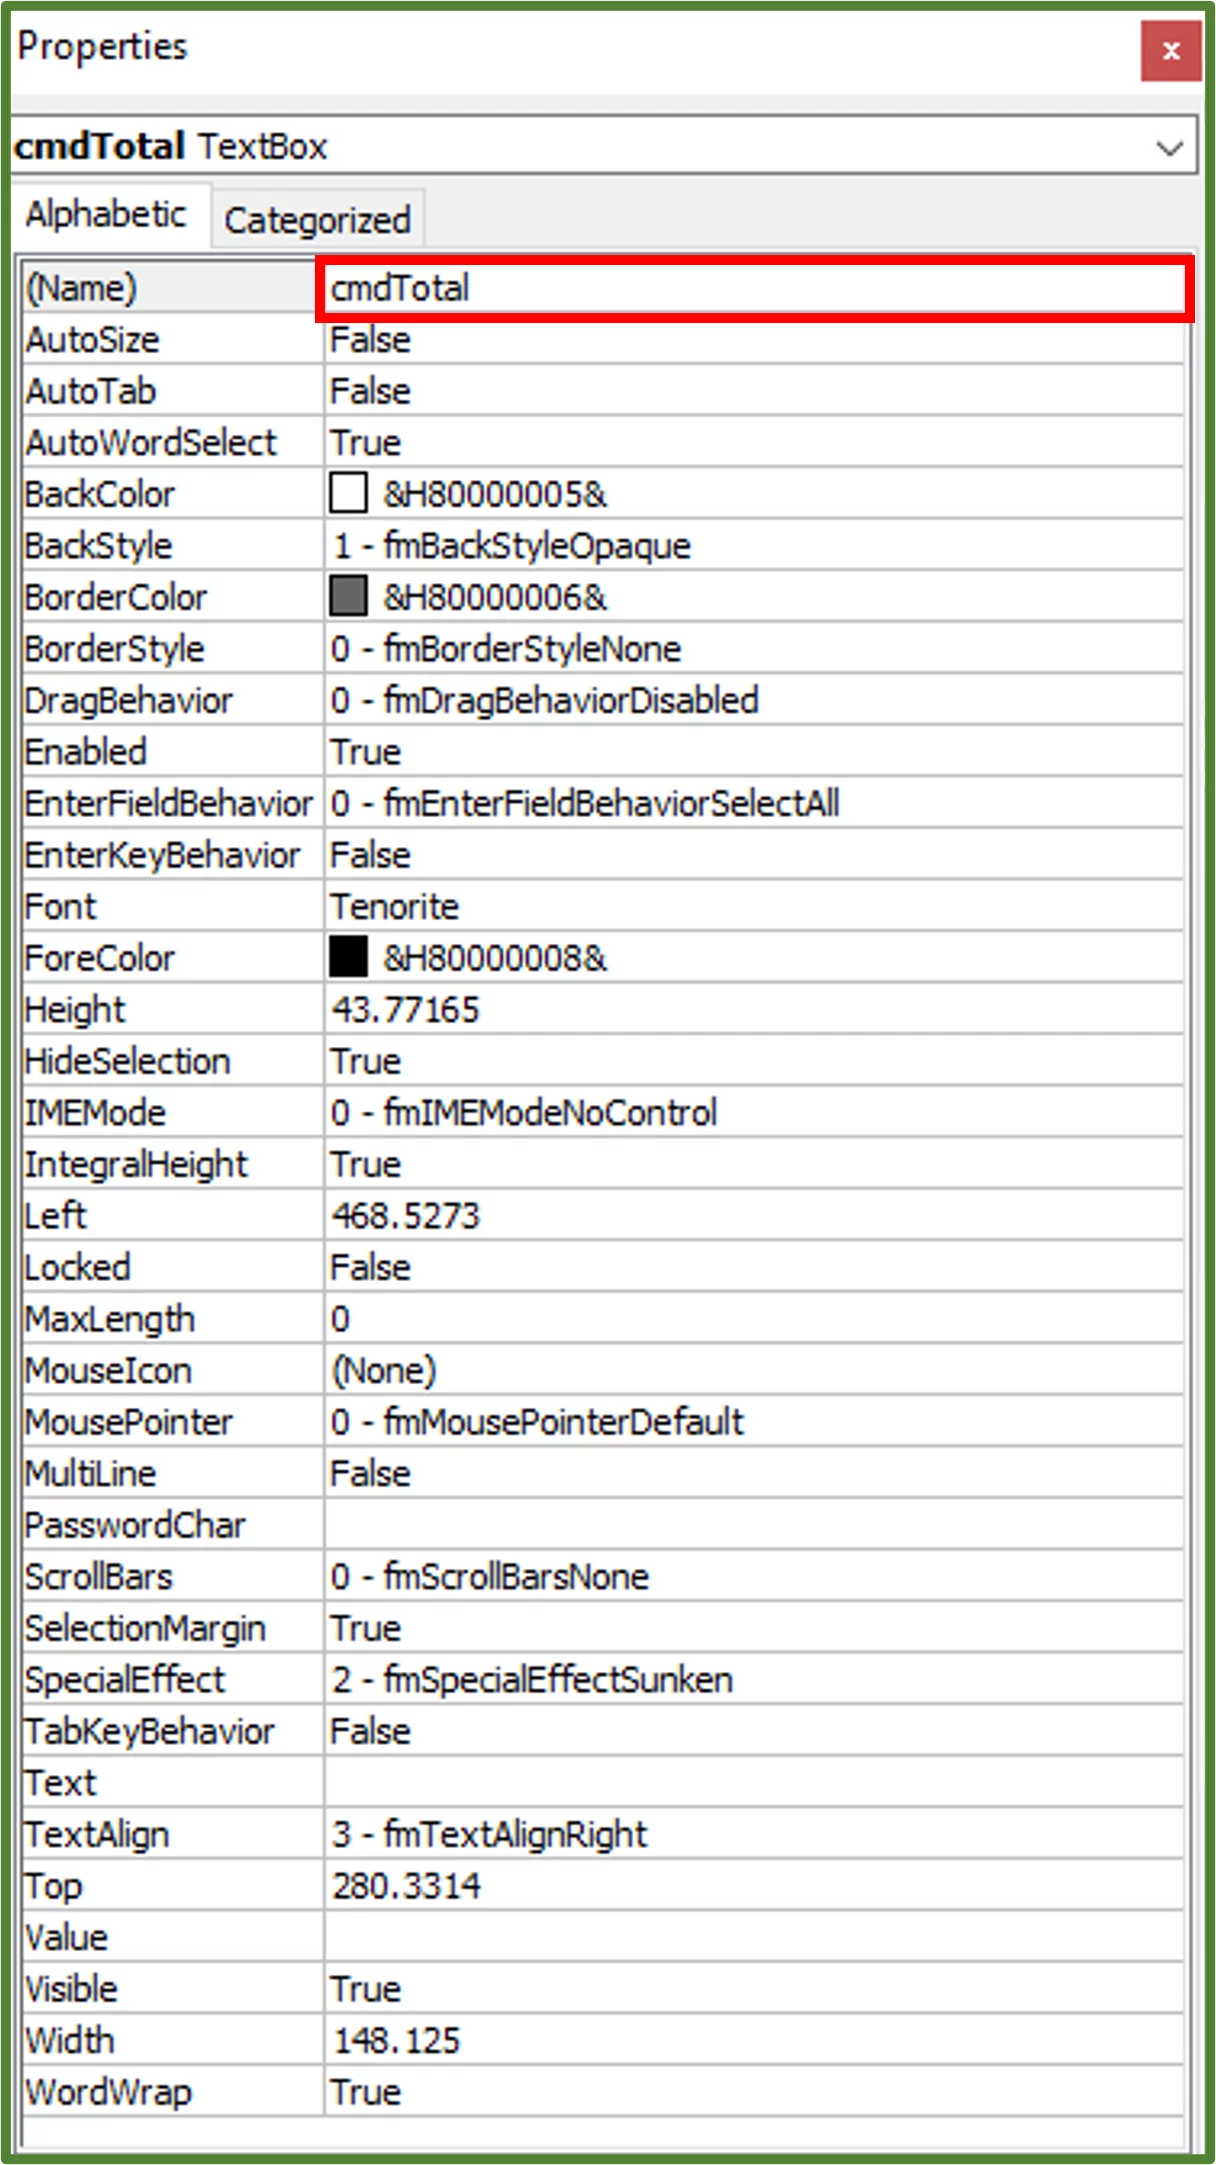
Now select the Text Box, we just created and press CTRL-D on the keyboard in order to duplicate it. With the duplicate selected go to the Developer Tab, and in the Controls Group, choose Properties.
Change the name of the duplicate to cmdTotal. The settings for the font and the text align should be the same as for the first Text Box. Close the Properties Window.
Now select the second Text Box, by clicking on it and then press CTRL-D on the keyboard. Select this duplicate and using the Properties Window name it cmdPercentage. Close the Properties Window.
You should now have the following.
Now while still in the Developer Tab, go to the Controls Group and this time add a button to the slide.
Select the button by clicking on it and then while still in the Developer Tab, go to the Controls Group and select Properties. Change the name of the button to cmdButton. Change the caption to Calculate. Set the font to Tenorite.
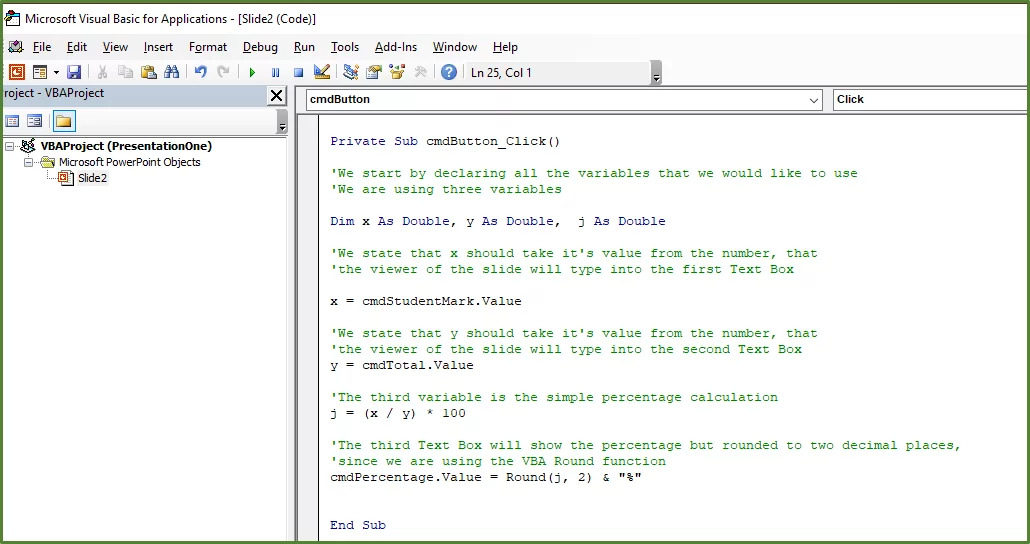
Now close the Properties Window. With the button still selected, go to the Developer Tab, and in the Controls Group, click View Code.
For the button click event enter the following code.
Private Sub cmdButton_Click()
‘We start by declaring all the variables that we would like to use in our code, of double data type
Dim x As Double, y As Double, j As Double
‘We state that x should take it’s value from the number, the user will type into the first Text Box.
x = cmdStudentMark.Value
‘We state that y should take it’s value from the number, the user will type into the second Text Box.
y = cmdTotal.Value
‘The third variable is the simple percentage calculation
j = (x / y) * 100
‘The third Text Box will display the percentage but rounded to two decimal places, since we are using the VBA Round function
cmdPercentage.Value = Round(j, 2) & “%”
End Sub
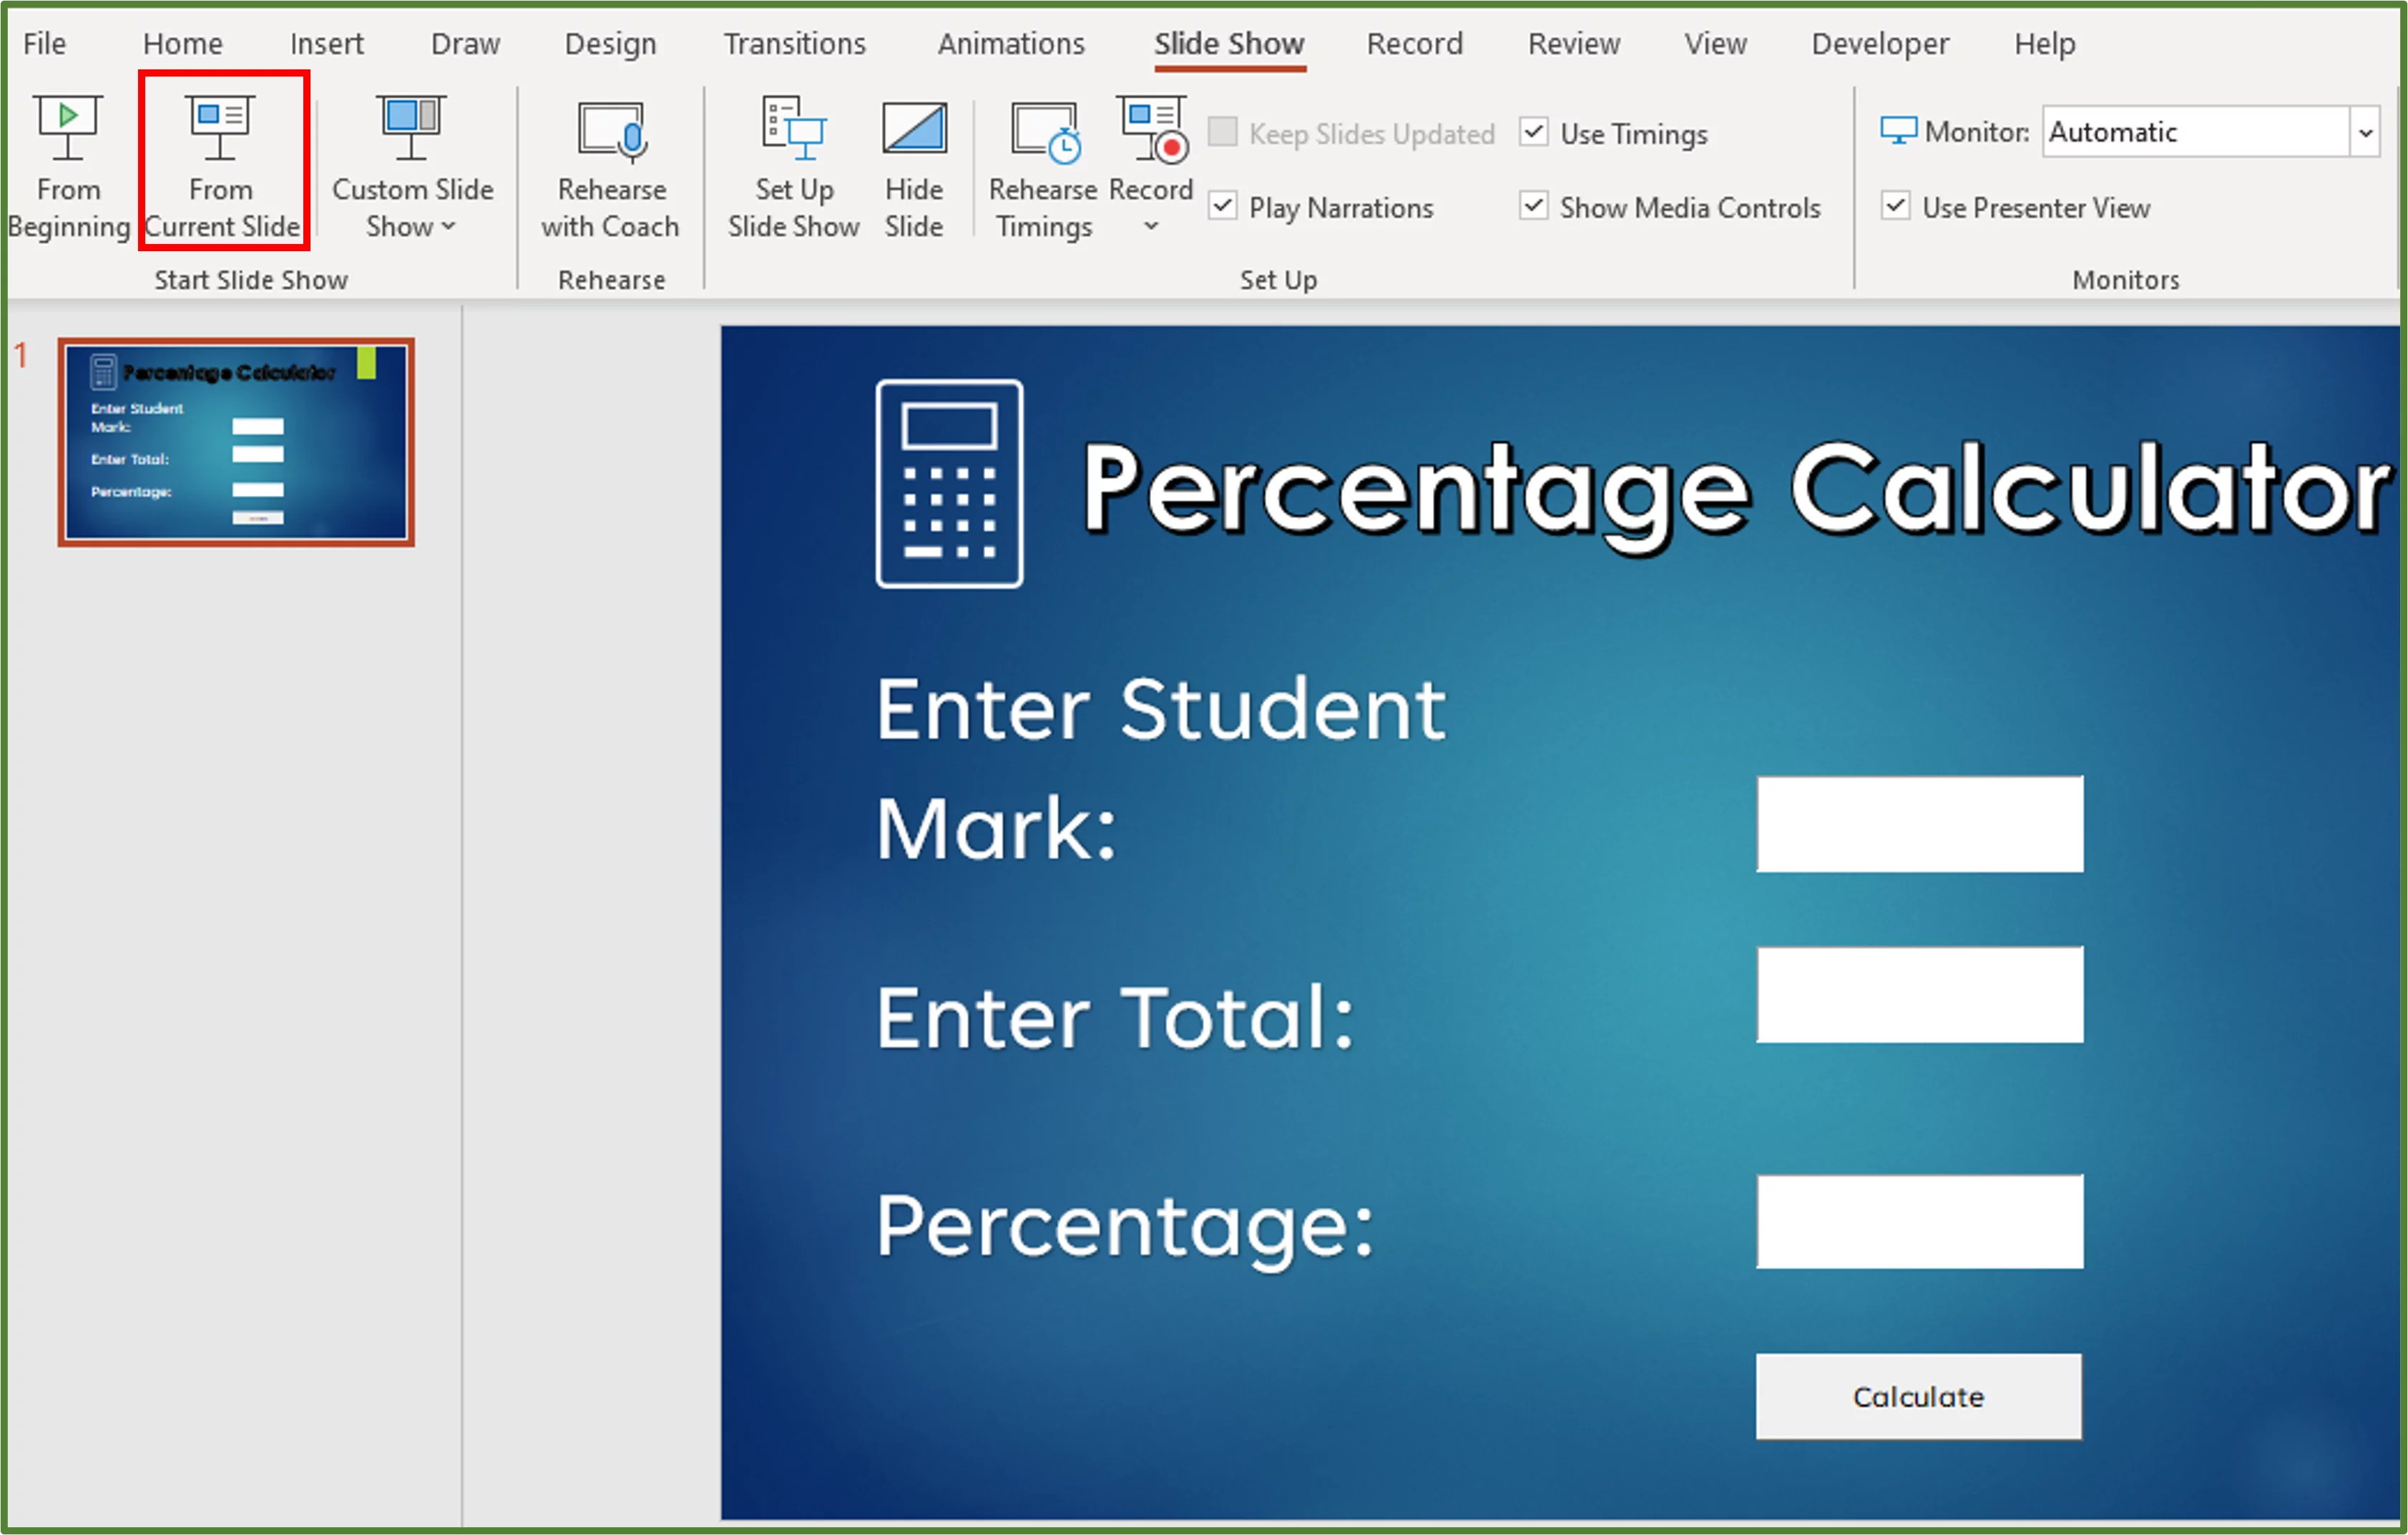
Now to work with our Calculator ( in terms of actually entering the numbers) we have to run the slide show.
Go to the Slide Show Tab, in the Start Slide Show Group either option will work in this case. We chose From Current Slide.
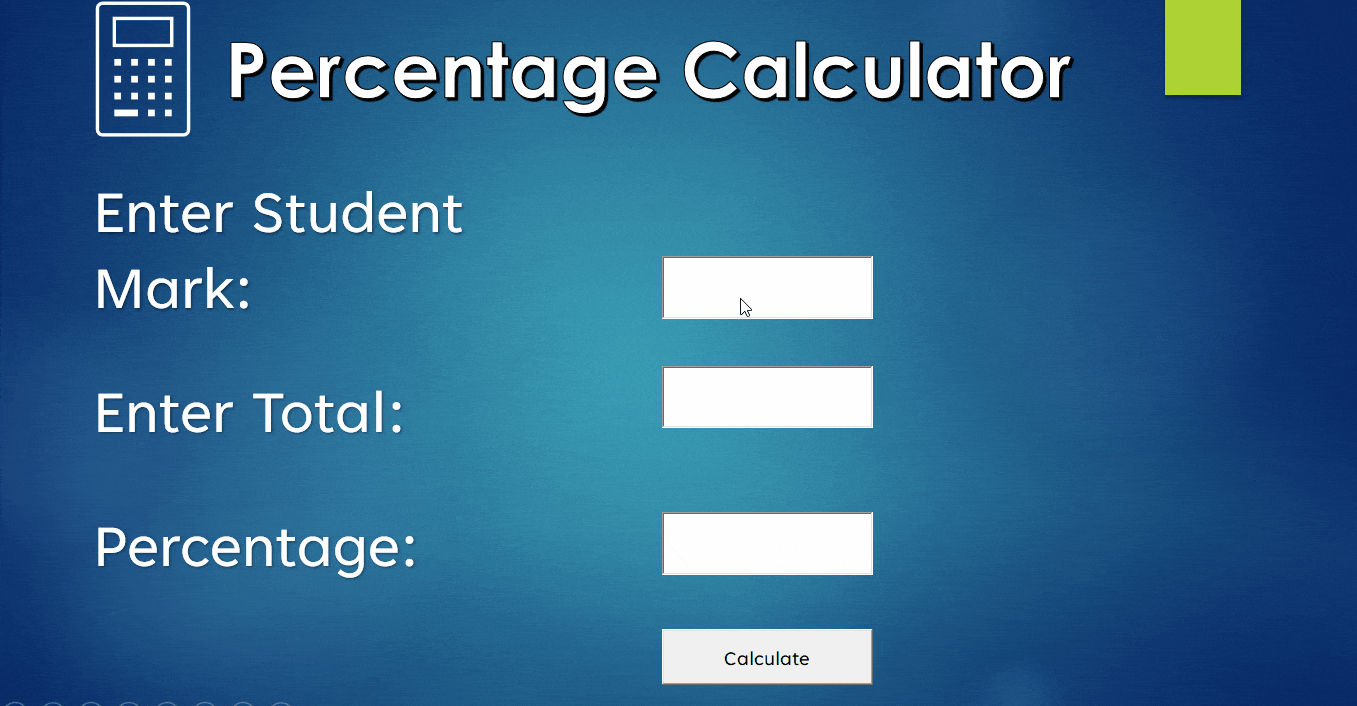
Enter a student mark in the first textbox, and a total in the second. Once you have done that, click the Calculate button and you should see the percentage as shown below.
Don’t forget to save your presentation as a macro-enabled presentation.

To learn more about what is covered in our VBA course, click here!
Learning Objectives
You now know how to:
- Calculate a simple percentage in Excel and Word.
- Work out the percentage change between two values
- Increase/Decrease an amount by a percentage
- Use VBA to create a simple percentage calculator in PowerPoint
Additionally you have an understanding of:
- What a percentage actually means
Conclusion
You can easily calculate a percentage in Excel. Furthermore, you can calculate the percentage change, and percentage increase/percentage decrease by using simple formulas.
These are skills that are helpful for both beginner and intermediate Excel users to know about.
Looking for more Excel tips? Check out the Excel Array Formulas – Master Multi-Cell And Single-Cell! article here.
Special thank you to Taryn Nefdt for collaborating on this article!
For more on Excel, check out this guide to calculate ages from date of birth!


- Facebook: https://www.facebook.com/profile.php?id=100066814899655
- X (Twitter): https://twitter.com/AcuityTraining
- LinkedIn: https://www.linkedin.com/company/acuity-training/