
Mapping Insights with Power BI Azure Maps
Contents
What if your maps could do more than just show dots on a page?
With Azure Maps in Power BI, you can transform raw location data into interactive, layered visuals that reveal insights at a glance.
Azure Maps is Microsoft’s next-generation mapping visual for Power BI.
Unlike the default Map and Filled Map visuals, it offers advanced features like heatmaps, clustering, and shape overlays.
These unlock deeper geographical storytelling.
Analysts in logistics, sales, and operations will find it much easier to spot trends, patterns, and opportunities.
Setting Up Azure Maps in Power BI
To start using Azure Maps:
1. Open Power BI Desktop.
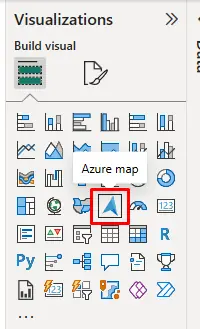
2. Go to the Visualizations pane and select Azure Maps (Preview).
3. Drag your Latitude and Longitude fields (or Region fields) into the visual.
4. Customize map styles, choose from road, satellite, or dark mode.
Advanced Features
Azure Maps does more than place pins!
These features help you find patterns fast and keep maps clear.
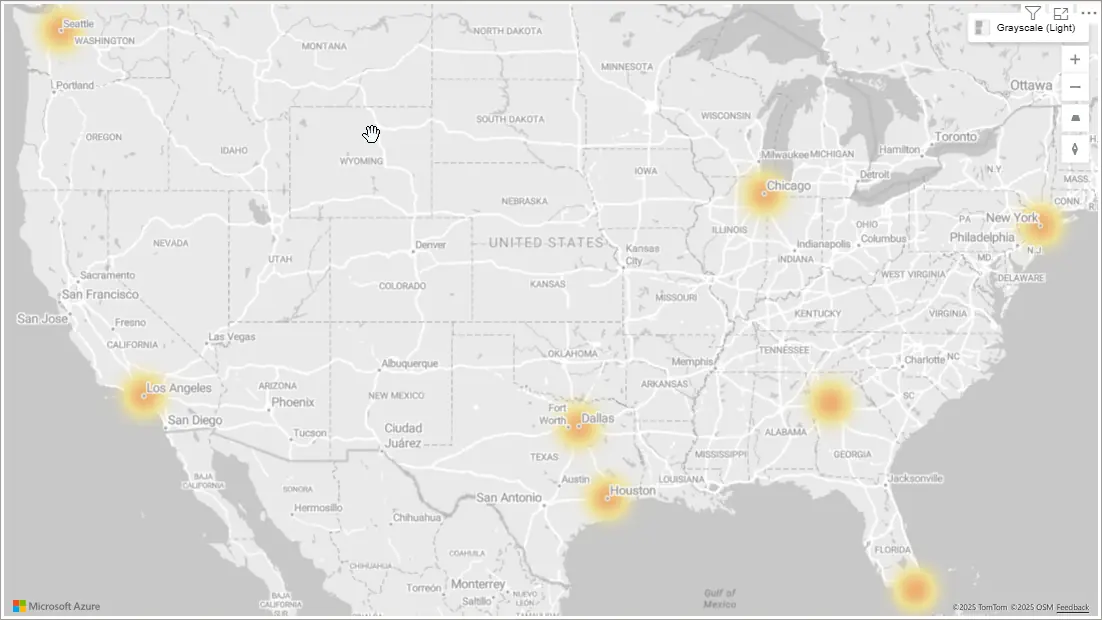
1. Heatmaps
Turn many points into a smooth density view. Great for large datasets.
Use heatmaps when you need to see hotspots at a glance.
- Spot high-order areas for deliveries.
- Find customer clusters for campaigns.
- See incident density for field teams.
Trainer Insight:
When people first try Azure Maps, they often just plot dots, and then wonder why it doesn’t feel useful.
We always encourage starting with heatmaps instead.
It instantly shifts the conversation from “where things are” to “where things are happening the most”.
This is what stakeholders really care about.
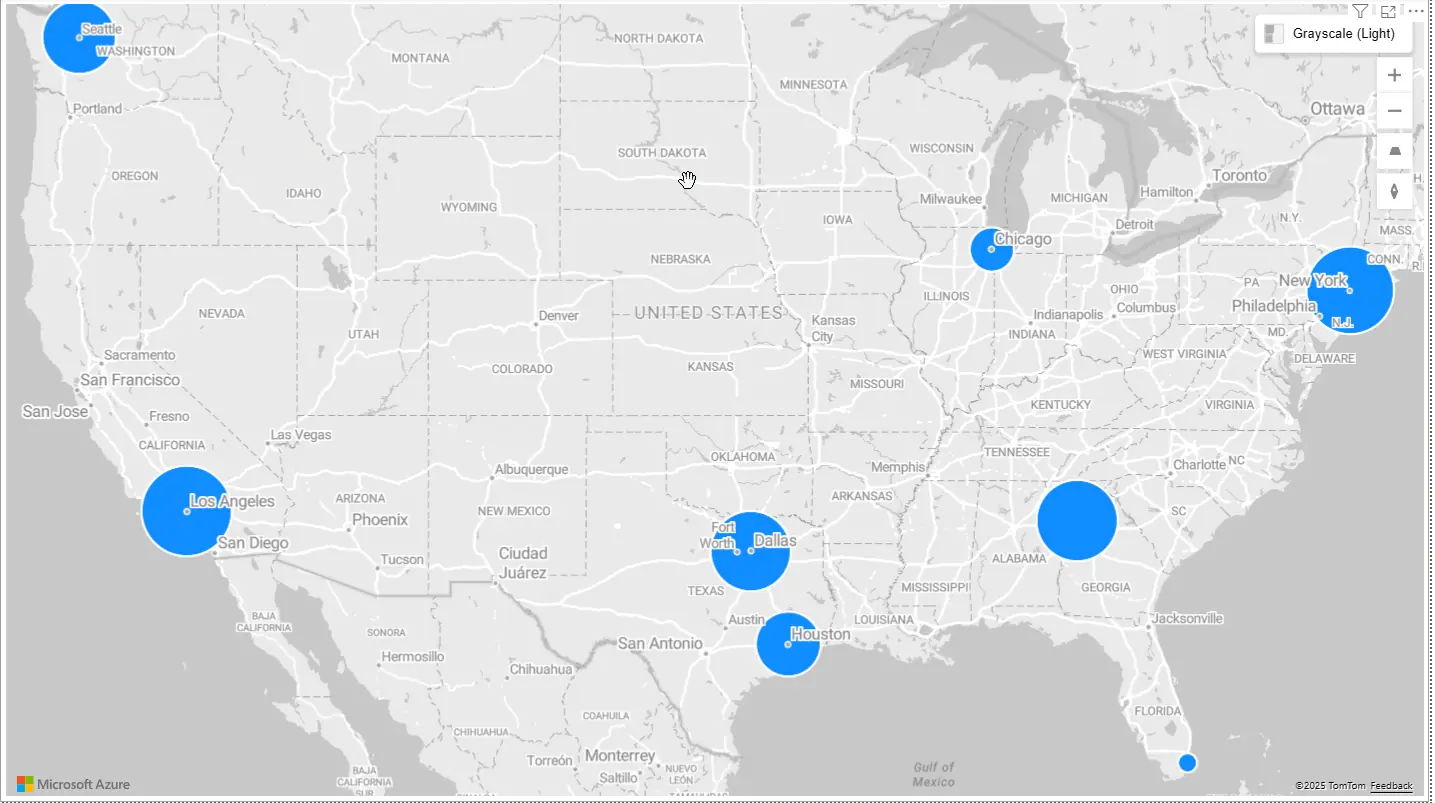
2. Clustering
Group nearby points into one symbol with a count. It expands as you zoom.
Use clustering to keep maps readable and fast.
- Summarise store locations by region.
- Show sales territories, then drill to deals.
- Display many sensors without clutter.
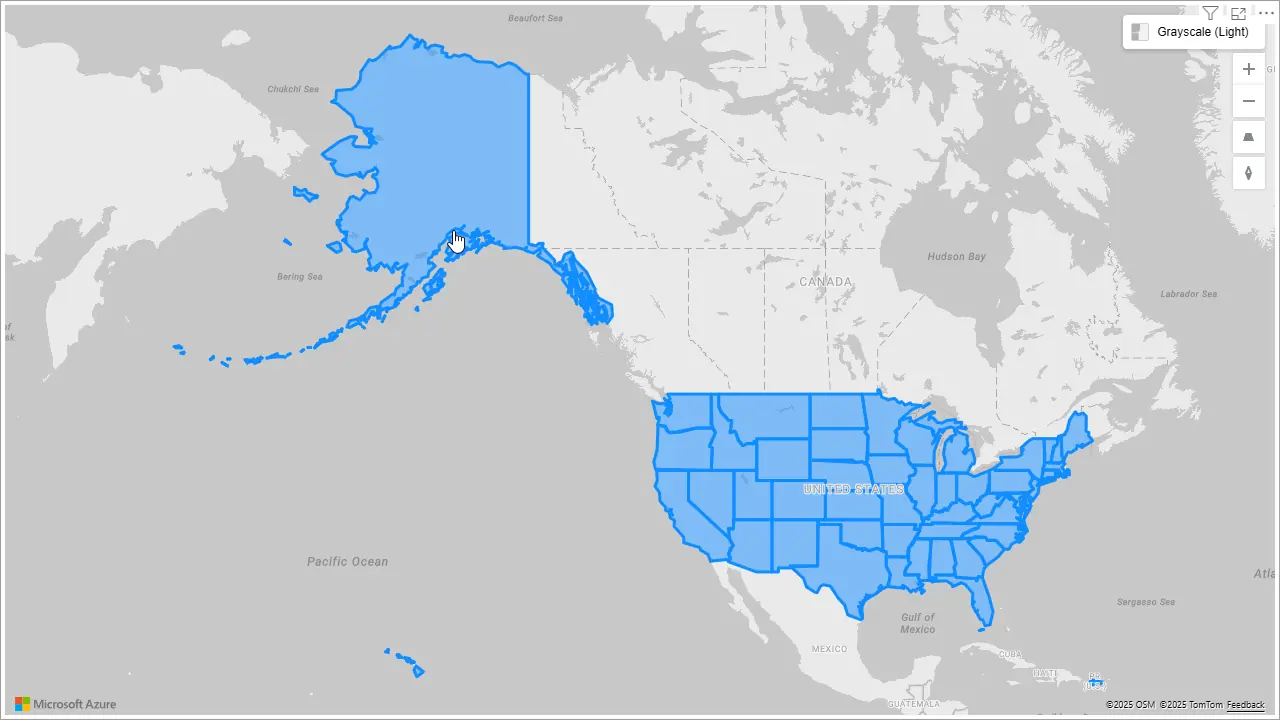
3. Shape Overlays
Add boundaries, trade zones, or custom polygons. Give context beyond pins.
Use shapes when decisions depend on regions.
- Compare sales by territory.
- Highlight warehouse catchments and delivery areas.
- Review performance by service district.
4. Custom Themes
Match brand colours and choose clear styles. Improve legibility and polish.
Use themes to aid focus and consistency.
- Apply brand styling for exec dashboards.
- Use dark mode for tablet and outdoor use.
- Differentiate sales vs. ops vs. demographic layers.
From Our Power BI London Courses
A common “aha” moment in our courses comes when people try custom themes.
Once they see their company’s colours on the map, the visual stops looking like a generic report.
It starts looking like their dashboard.
A common “aha” moment in our courses comes when people try custom themes.
Once they see their company’s colours on the map, the visual stops looking like a generic report.
It starts looking like their dashboard.
Practical Use Cases
Here are three real-world applications:
-
-
- Sales Performance by Region
A sales director can map quarterly revenue by state, instantly spotting underperforming regions.
By layering KPIs, the team increased sales campaign effectiveness by 12% in Q2. - Logistics and Operations
A delivery service tracked field agents with Azure Maps, allowing dispatchers to reroute drivers in real time.
Result: 15% faster deliveries during peak holiday season. - Demographic and Market Analysis
A delivery service tracked field agents with Azure Maps, allowing dispatchers to reroute drivers in real time.
Result: 15% faster deliveries during peak holiday season in the Manchester area using Power BI.
Limitations & Licensing
Before rolling out Azure Maps widely:
-
-
- Licensing: Some features (e.g., weather overlays) require an Azure subscription or Premium licensing.
- Performance: Very large datasets can slow rendering. Consider aggregation or filtering.
- Data Accuracy: Poor geocoding can misplace addresses, ensure clean, validated data.
-
Conclusion
Azure Maps unlocks a new level of geospatial storytelling in Power BI.
-
-
- Start simple with basic maps.
- Gradually layer in heatmaps, clustering, and overlays as your dataset grows.
- Validate your geocoding and watch for performance tradeoffs.
-
Whether you’re in sales, logistics, or field services, Azure Maps makes your dashboards more insightful, interactive, and actionable.
- Sales Performance by Region
-


- Facebook: https://www.facebook.com/profile.php?id=100066814899655
- X (Twitter): https://twitter.com/AcuityTraining
- LinkedIn: https://www.linkedin.com/company/acuity-training/