

Is Power BI Easy to Learn?
The difficulty of Power BI depends almost entirely on what you’re trying to do with it. There’s a huge gap between “I can use Power BI” and “I’m a Power BI expert” and most people won’t tell you that.
If you want to connect a spreadsheet, build a dashboard, and share it with your team, you can do that on your first day.
If you want to write complex DAX measures, optimise a data model for thousands of users, and manage row-level security, you’re looking at months of practice.
This guide gives you an honest breakdown of what you can do at each stage, who picks it up fastest, and what most self-taught learners consistently get wrong.
What You Can Do on Day One
Most articles get vague here. Here is what a complete beginner will cover in our one-day Introduction to Power BI course:
- Connect data from multiple sources, including Excel files, SQL databases, cloud services, and live web data
- Prepare and transform data using Power Query
- Create visualisations including charts, tables, maps, and KPI cards
- Build a report combining multiple visuals on a single canvas
- Publish reports to the web or export directly to PDF
By the end of day one, all of our delegates can build a working report from scratch and share it with their team.
How We Structure Our Training: At Acuity Training we design our training around whoever is attending.
While there are clear learning outcomes every delegate will cover, you can specify what you need Power BI for and get the guidance you need.
For us, training isn’t just a checklist of skills, but a way to get people back in the office feeling confident and
Who Picks It Up Fastest
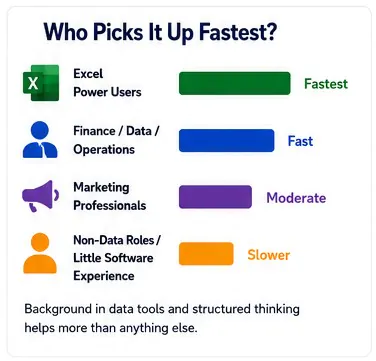
Whenever you pick up a new software, your background and experience are the two biggest factors.
Excel power users pick up Power BI faster than any other group. The core logic is familiar: you’re still thinking about rows, columns, relationships between tables, and summarising data. The interface changes but the mental model carries across. Functions like SUMIF in Excel translate almost directly into DAX measures in Power BI.
From our experience training delegates across London, the people who perform by far the best are those who already work with similar or foundational tools, particularly Excel. People with little software experience are not far behind, but they typically take a little longer to get comfortable with concepts like data relationships and table logic.
Finance analysts, data teams, and operations professionals tend to progress quickly for the same reason: they already think about data in a structured way.
Marketing professionals and non-data roles on the other hand often find the visual side straightforward but slow down during data preparation.
Is DAX Really Important?
DAX is the reason most people are nervous about Power BI, but a lot of this anxiety is misplaced!
DAX (Data Analysis Expressions) is Power BI’s formula language. You do not need it for most day-to-day reporting.
Here is what you can do without writing a single DAX formula:
- Connect and clean data from multiple sources
- Build charts, tables, maps, and slicers
- Create relationships between data tables
- Publish and share reports across your organisation
- Use built-in aggregations like SUM, COUNT, and AVERAGE
Where DAX becomes necessary is when you need calculations that drag-and-drop cannot handle: year-on-year comparisons, rolling averages, calculated columns based on conditional logic, or measures that change based on which filters are active.
A useful rule of thumb: if your job involves building dashboards for others to read, you will need DAX within about three months. If you are analysing data for your own use, you can go much further without it.
The salary data supports this: according to Hays’ 2026 UK Technology Salary Guide, Power BI professionals with strong DAX skills earn 15–20% more than those without.
We run dedicated Introduction to DAX and Advanced DAX courses at Acuity Training for exactly this reason. It is a separate skill that builds on top of Power BI, not a prerequisite for getting started.
How Long Does It Actually Take?
The gap between structured training and self-teaching is significant at every stage. YouTube tutorials teach features in isolation. A structured course teaches the workflow, which is what actually makes Power BI useful at work.
| Stage | What you can do | With structured training | Self-taught |
|---|---|---|---|
| Beginner | Connect data, build visuals, publish reports | 1 day | 2-4 weeks |
| Intermediate | Slicers, filters, Power Query, basic data models | 2–3 days | 1-2 months |
| Advanced | DAX, complex data modelling, performance tuning, security | 1 additional week | 3-6 months |
What Self-Taught Learners Get Wrong
Acuity Training’s trainers see the same patterns repeatedly in delegates who tried to learn Power BI alone before attending a course.
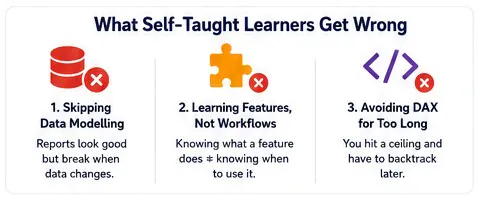
The most common mistake is skipping data modelling. Most online tutorials jump straight to building visuals, which looks impressive but produces reports that break the moment the underlying data changes. Understanding how tables relate to each other is the foundation everything else sits on.
The second issue is learning features rather than workflows. Knowing what a slicer does is different from knowing when to use a slicer instead of a filter, and when neither is the right answer. Structured training covers the decision-making, not just the mechanics.
Third: avoiding DAX for too long. Learners who skip it in the early stages often hit a hard ceiling at the intermediate level and have to go back and rebuild foundations they should have developed earlier.
What London Employers Actually Need
There are currently more than 4,800 active Power BI roles advertised on Indeed UK, with demand growing consistently year on year. The median UK salary for a Power BI Analyst is £47,500, according to IT Jobs Watch live job posting data.
Based on the organisations Acuity Training works with in London, including BP, NatWest, the NHS, J.P. Morgan, and the UN, the Power BI skills that come up most consistently are:
- Clean, shareable reports that non-technical colleagues can read and filter themselves
- Automated data refresh connected to live sources
- Basic DAX for time-based comparisons, month vs last month, year to date
- Row-level security for reports shared across departments with different data access
Very few London roles require advanced DAX or complex data modelling at entry level. The baseline that gets people hired and productive is the intro-to-intermediate level, which most people reach within two to three days of structured training.
Common Questions
We’ve been running Power BI training across London for years, so we get a lot of people calling in with questions!
Here’s what people ask most often before booking their Power BI course.
Do I need to know SQL to learn Power BI?
No. Power BI’s built-in Power Query editor handles the vast majority of data transformation tasks without writing a line of code, including cleaning columns, merging tables, unpivoting data, and filtering rows. SQL becomes useful when connecting directly to large enterprise databases and filtering data before it loads into Power BI. This keeps file sizes manageable and improves report performance. For most business users and analysts, Power Query covers everything they need indefinitely.
Is Power BI harder than Excel?
For basic tasks, no. Excel is more familiar to most people, but Power BI’s drag-and-drop interface for building charts, tables, and dashboards is straightforward once you have spent a few hours with it. The learning curve steepens around data modelling, which Excel largely sidesteps by letting you work in a single flat table. If you already use Excel regularly, the mental model of rows, columns, and table relationships carries across directly and will give you a significant head start in Power BI.
Can I learn Power BI in a week?
Yes, to a working level. With structured training, most people can connect data sources, build dashboards, apply filters and slicers, and publish reports within two to three days. A full week of focused learning gets you to a point where you can handle real business reporting tasks independently. Fully mastering advanced features like DAX and complex data modelling takes longer, but most roles will not require that at entry level.
Do I need to learn DAX straight away?
No. A significant amount of useful reporting can be done using Power BI’s built-in aggregations like SUM, COUNT, AVERAGE, MAX, and MIN, without writing any DAX at all. DAX becomes necessary when you need calculations that drag-and-drop cannot produce: year-on-year comparisons, rolling averages, or measures that respond dynamically to a user’s filter selections. Most people reach that point within the first two to three months of regular use.
Is Power BI worth learning in 2026?
Yes. Microsoft has been named a Leader in the Gartner Magic Quadrant for Analytics and BI Platforms for the 18th consecutive year, the longest unbroken run of any vendor in the category.
UK job listings for Power BI roles have grown year on year, and salaries reflect the demand – particularly for analysts with strong DAX skills.
Conclusion
Power BI is accessible, and it’s easy to get going. But quite honestly, it’s harder to master than most other guides out there will tell you.
When learning Power BI, you can get the basics in just a day, become competent in a week of structured training, and grow to be genuinely advanced within a few months of effort.
For most people, the goal is not to master every corner of Power BI. Your goal should be to get to the level where Power BI stops getting in the way and starts doing what you need.
With our training, that level isn’t far away!
- Facebook: https://www.facebook.com/profile.php?id=100066814899655
- X (Twitter): https://twitter.com/AcuityTraining
- LinkedIn: https://www.linkedin.com/company/acuity-training/