
Improving Your Power BI Rollout: A Complete Guide
Contents
- 1 How Acuity Training Makes Power BI Rollouts A Success
- 2 Step 1: Define Clear Objectives & Success Criteria
- 3 Step 2: Start Small with a Pilot, Then Scale
- 4 Step 3: Prepare Your Data Foundations
- 5 Step 4: Build Governance & Security from Day One
- 6 Step 5: Invest in Training & User Readiness
- 7 Step 6: Measure Adoption & Refine Continuously
- 8 Step 7: Optimise for Performance & Scale
- 9 Case Study: Scaling Power BI in a UK Retail Chain
- 10 Power BI Rollout Checklist
Rolling out Microsoft Power BI is more than a software deployment.
It’s a business transformation initiative that requires aligning people, processes, and technology.
Successful adoption depends on three pillars: governance, adoption, and measurement.
Organisations that underinvest in training or governance often see “dashboard sprawl” – multiple versions of the truth, low user engagement, and wasted licensing costs.
This guide outlines practical steps to improve your Power BI rollout, with lessons from real case studies.

How Acuity Training Makes Power BI Rollouts A Success
At Acuity Training, we don’t just teach the software – we help organisations build a lasting culture of data-driven decision-making.
With over 20 years’ experience in corporate training, we combine hands-on Power BI expertise with proven change management strategies.
Our role-based training, governance guidance, and tailored rollout support ensure your dashboards are trusted, adopted, and delivering measurable ROI.
Whether you’re starting with a pilot or scaling across the enterprise, our team makes sure your Power BI investment becomes a true business success.
Step 1: Define Clear Objectives & Success Criteria
Before building dashboards, establish what success looks like.
-
Business goals (e.g., reduce month-end reporting time by 50%).
-
Adoption KPIs: active users, report views, refresh success rate.
-
Scope: Which departments are in the first rollout wave?
👉 Tip: Set measurable goals up front so you can benchmark progress later.
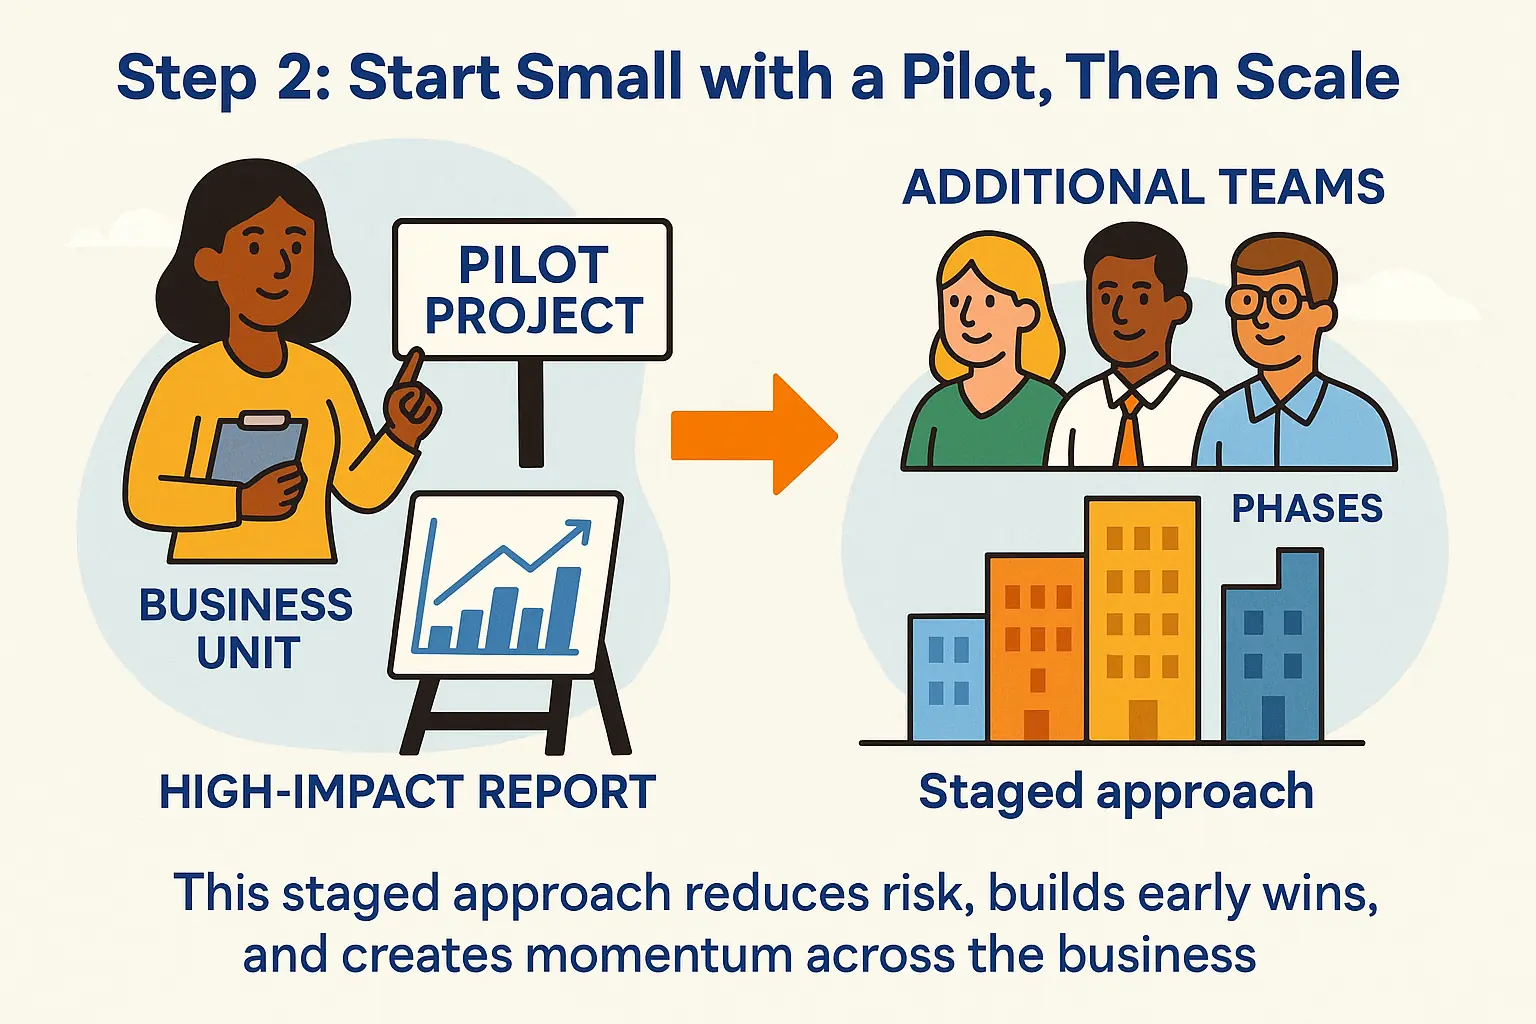
Step 2: Start Small with a Pilot, Then Scale
Rolling out to the entire organisation at once is risky. Instead, begin with a pilot project:
-
Select a business unit with motivated stakeholders.
-
Deliver a small set of high-impact reports.
-
Collect feedback and refine your governance model.
Once validated, scale to additional teams in phases. This staged approach reduces risk, builds early wins, and creates momentum across the business.
Step 3: Prepare Your Data Foundations
Power BI is only as strong as the data feeding it. Poor models or inconsistent definitions are a common rollout killer.
-
Data inventory: Identify systems of record and ownership.
-
Quality checks: Standardise hierarchies, naming, and formats.
-
Model design: Aim for star schemas for performance.
-
Refresh strategy: Define gateway connections, schedules, and monitoring.
Strong data preparation ensures that reports are accurate, performant, and trusted by business users.
Step 4: Build Governance & Security from Day One
Without governance, rollouts quickly descend into uncontrolled “report sprawl.”
-
Workspace strategy: Separate environments for development, testing, and production.
-
Access & RLS: Implement role-based access and Row-Level Security.
-
Naming conventions: Keep models and reports consistent.
-
Governance committee: Blend IT and business leadership to make decisions.
A governed self-service model allows end users the freedom to create reports while ensuring that standards and controls remain in place.
Step 5: Invest in Training & User Readiness
The single biggest driver of adoption is training. Power BI is powerful but can overwhelm new users if they are left unsupported.
-
Role-based training: Executives focus on dashboards; analysts on DAX and data modelling; end-users on report navigation.
-
Champions programme: Empower “super users” as local advocates to provide peer support.
-
Delivery options: Mix classroom, online, and self-paced modules.
Our team has delivered corporate Power BI training in the UK for over 10 years, helping organisations accelerate adoption and achieve measurable ROI.
Training isn’t a “nice to have” – it’s the difference between widespread adoption and shelfware.
From Our Experience Rolling Out Power BI:
We once worked with a manufacturing firm that launched Power BI without structured training.
After six months, they had dozens of reports, but most staff still relied on Excel because they didn’t know how to navigate dashboards confidently.
When we introduced a role-based training programme, executives focused on KPIs, analysts learned DAX, and end-users practised with live dashboards.
Adoption jumped from 20% to 70% within three months.
It proved that even the best-built dashboards fail without giving people the skills and confidence to use them.
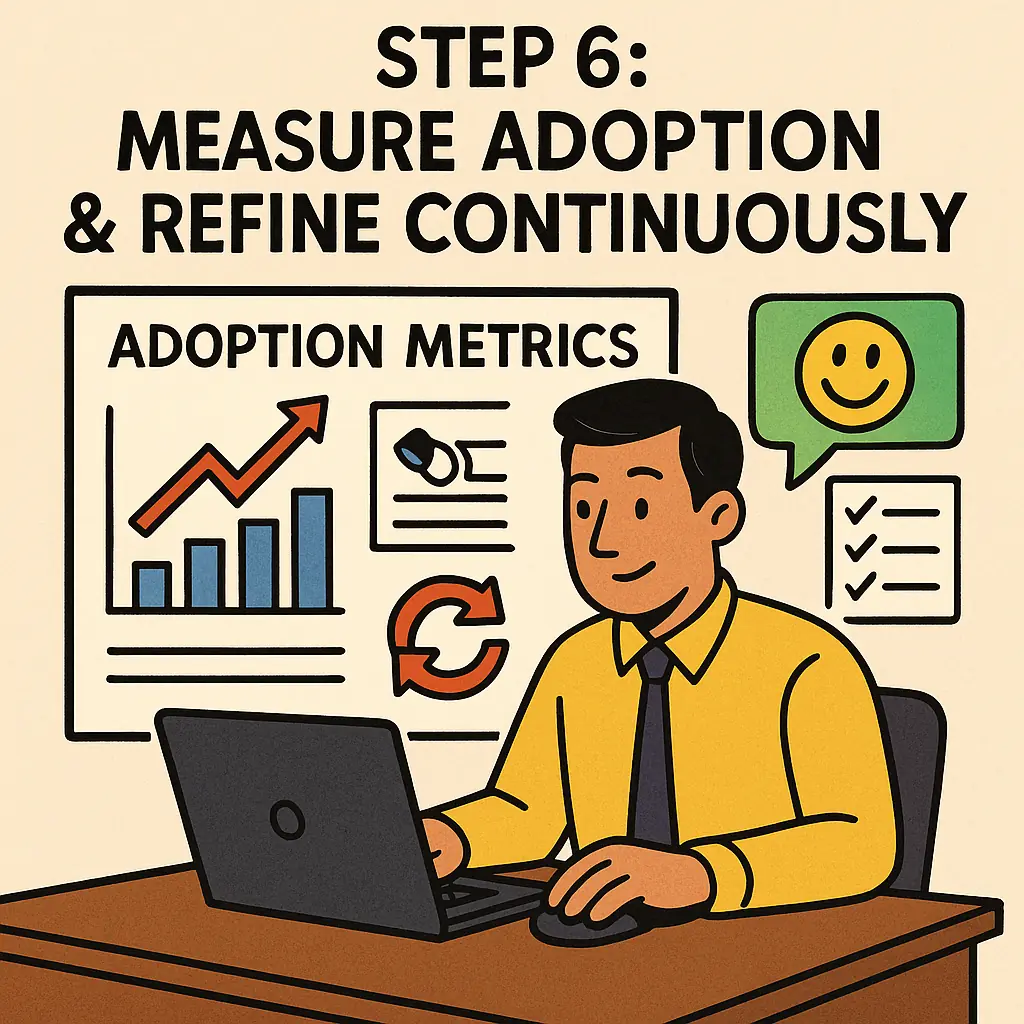
Step 6: Measure Adoption & Refine Continuously
Adoption is not an event; it’s a process. Tracking metrics helps you prove value and identify gaps.
Key adoption KPIs include:
-
Active users per month.
-
Report views and interaction rates.
-
Error rates on data refreshes.
-
User satisfaction scores from surveys.
By reviewing these regularly, you can spot when adoption is plateauing and take action — such as running refresher training sessions or introducing new, business-relevant reports.
Step 7: Optimise for Performance & Scale
As adoption grows, dashboards must perform under heavier loads. Poor performance erodes user trust and can stall momentum.
-
Optimise data models: Reduce unnecessary columns, pre-aggregate where possible.
-
Tune DAX queries: Ensure query folding and efficient calculations.
-
Scale capacity: Monitor Premium capacity, gateway performance, and adjust resources as needed.
Continuous optimisation ensures that Power BI scales smoothly as your rollout matures.
Case Study: Scaling Power BI in a UK Retail Chain
At Acuity Training, we worked with a mid-sized UK retailer that had launched Power BI across finance and operations in 2022.
Their first attempt stalled: users found reports confusing, and adoption plateaued at just 18%.
After we advised investing in role-based training and a champions network, adoption grew to 65% within six months.
Dashboards such as “daily sales tracker” and “inventory insights” became embedded into daily decision-making.
The retailer’s Head of Analytics summarised:
“Training was so important – it was the difference between another failed IT project and a company-wide culture of data-driven decisions.”
Power BI Rollout Checklist
Use this quick checklist to benchmark your rollout:
☐ Defined business objectives & KPIs.
☐ Pilot team selected & early dashboards delivered.
☐ Data model reviewed & optimised.
☐ Governance model approved (workspaces, RLS).
☐ Role-based training delivered.
☐ Champions programme launched.
☐ Adoption metrics tracked via telemetry.
☐ Continuous optimisation plan in place.


- Facebook: https://www.facebook.com/profile.php?id=100066814899655
- X (Twitter): https://twitter.com/AcuityTraining
- LinkedIn: https://www.linkedin.com/company/acuity-training/