Power BI Statistics You Need To See (2025)
Contents
- 1 Key Takeaways – Power BI Statistics 2025
- 2 1: How Much Time Does Power BI Save?
- 3 2: How Much Faster Is Reporting With Power BI?
- 4 3: How Many Organisations Are Increasing Power BI Adoption?
- 5 4: What Is Power BI’s Market Share?
- 6 5: How Quickly Does Power BI Pay for Itself?
- 7 6: How Widely Used Is Power BI Among the Fortune 500?
- 8 Final Thoughts
- 9 Sources & References
Power BI continues to dominate the analytics and business intelligence market.
From small businesses, to the biggest conglomerates in the world – Power BI is the go-to software.
As a Power BI training company, it’s important we stay on top of Power BI, it’s usage and importance as time goes on.
To make it clear just how huge Power BI has become, we gathered the most shocking, impactful and insightful statistics out there.
Key Takeaways – Power BI Statistics 2025
For a bite size snippet of our report, we’ve summarised what we consider the most interesting statistics on Power BI.
You can find more detail and context within the article:
- Power BI saves its users over 2 hours a week, thanks to self-service reporting.
- Power BI’s automation makes producing reports 2.5x faster.
- 58% of organisations are focused on increasing Power BI adoption.
- Power BI now holds almost a third (30%) of the global BI market share.
- More than half of all organisations (58%) see Power BI pay for itself in under a year.
- Almost every (97%) Fortune 500 company relies on Power BI for business intelligence.
1: How Much Time Does Power BI Save?
Power BI’s self-service reporting tools make it easy for any users to create and manage their own reports.
Instead of relying on analysts, end-users can piece together their own dashboards and reports.
This saves time for everyone, end-users get what they need quickly – and analysts have fewer requests to deal with.
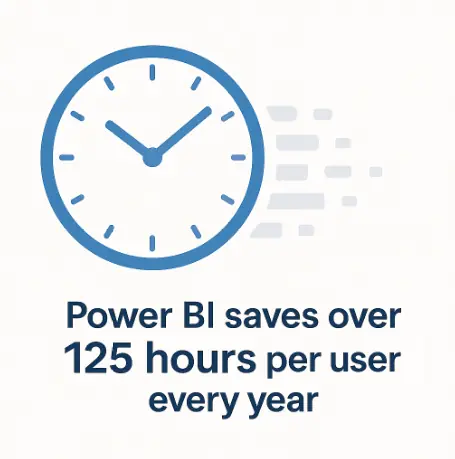
All included, this saves over 125 hours for each Power BI user, a huge amount of time, especially when you start to add this up over an entire organisation.
So Power BI doesn’t just make reporting more accessible, but it saves tangible time for everyone that uses it.
If you’re just looking to get into Power BI, our guide on creating dashboards in Power BI will show you how easily these time savings can be achieved.
2: How Much Faster Is Reporting With Power BI?
Power BI makes creating and updating reports much more efficient, because of its automation features.
Instead of manually updating spreadsheets, and rebuilding visuals each week, reports automatically refresh with the latest data available.
This eliminates repetitive manual work, and helps cut down on reporting mistakes.
Using these automation tools makes producing reports 2.5x faster than normal reporting methods.
3: How Many Organisations Are Increasing Power BI Adoption?
Power BI is not just popular – it’s constantly growing.
Recent research shows that 58% of organisations are actively focused on increasing their use of Power BI.
This continued adoption shows that Power BI is a key part of modern business infrastructure, not just a specialist tool for data analysts!
Part of what makes it so appealing to adopt, is how easily you can introduce governance and implement it.
We’d go as far as to say, Power BI is essential for staying competitive.
So Power BI is huge. But it’s not just about how many people are using it – it’s about how dominant it is.
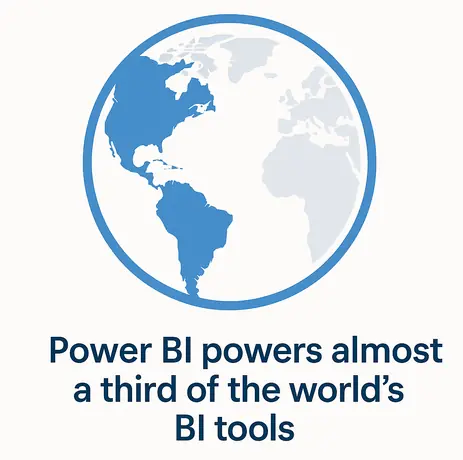
Power BI holds almost a third of the global BI market share, and has solidified itself as the clear leader among analytics platforms.
This means that roughly one in every three business intelligence tools worldwide runs on Power BI technology.
A large market share doesn’t just indicate popularity: it shows trust and reliability.
It also means a bigger ecosystem of integrations, plugins, and learning resources.
5: How Quickly Does Power BI Pay for Itself?
Implementing Power BI doesn’t just deliver insights: it delivers a fast financial return.
Most organisations report that Power BI pays for itself in under a year.
The ROI adds up quickly: teams work faster, fewer external reporting tools are needed, and better decisions are made with less delay.
A platform that offers automation, collaboration, and high usability at a low cost naturally leads to a strong return on investment.
For most companies, Power BI becomes a profit generator, not a software expense.
6: How Widely Used Is Power BI Among the Fortune 500?
If you needed even more proof that Power BI is the market leader, just have a look at the Fortune 500.
An impressive 97% of Fortune 500 companies now rely on Power BI for their analytics.
That means, nearly all the world’s largest organisations, use Power BI.
This widespread use demonstrates Power BI’s ability to perform at scale, capable of handling the most complex data challenges in the corporate world.
For smaller organisations, it’s reassuring to know that the same tool trusted by the biggest global players is also available, affordable, and easy to adopt.
Final Thoughts
Power BI’s impact on modern business is undeniable.
It saves time, increases efficiency, reduces costs, and drives better data-driven decisions – all across industries, company sizes, and geographies.
Power BI has proven itself as the most powerful and accessible BI platform in the world.
Sources & References
This report compiles data from publicly available sources, including:
The Forrester Total Economic Impact™ of Microsoft Power BI.
Vocal Media’s 10 Essential Benefits of Power BI That Transform Modern Businesses.
Gartner’s Magic Quadrant for Analytics and BI Platforms.
Intuition labs’ Tableau vs Power BI Market Analysis & Comparison.
Gocollectiv’s Power BI Adoption Stats.
All data is accurate to the latest reports available as of November 2025.
- Facebook: https://www.facebook.com/profile.php?id=100066814899655
- X (Twitter): https://twitter.com/AcuityTraining
- LinkedIn: https://www.linkedin.com/company/acuity-training/


