
Power BI Relationships Explained (And Why “Many-to-Many” Is Almost Always Wrong!)
Contents
Relationships sit at the heart of literally everything you do in Power BI.
Before you make measures, visuals and reports, relationships are established to define how your data fits together. Their job is simple on the surface – but vital: describe how each table is connected.
If you can design these relationships well, everything else will run much smoother.
Across any data domain, strong models rely on clear Grain, correct Cardinality, and a Star Schema built with well-defined Fact and Dimension tables.
Why Relationships Matter in Power BI
So relationships are meant to describe how tables connect, but what does that actually look like?
Relationships are how we start our City of London Power BI workshops – every visual and measure depends on this logic, so getting it right the first time is very important!
At a basic level, a relationship is telling Power BI how rows in one table relate to rows in another. When you apply a filter to a visual for example, Power BI uses these relationships to decide what data needs to be in that visual.
That makes them the foundation of your entire dashboard. Every single visual, filter and measure you want to build is standing on the shoulders of the relationships.
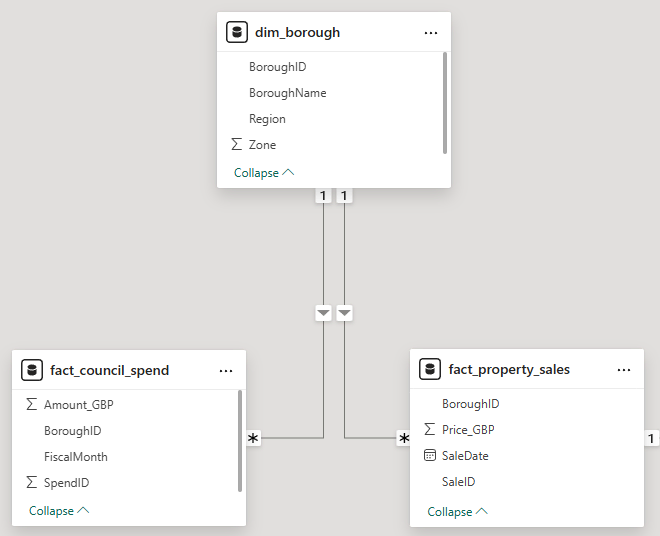
The data model is where you can define these relationships, so let’s take a look at one from our recent London borough demographics walkthrough.
In this model, we have dim_borough in the centre, there’s one row per borough along with descriptive fields (name, region, zone). This table represents how you want to slice and explore the data.
Below it are two separate fact tables, one contains council spend, and another contains property sales. Each of these tables will have many rows for each borough, representing individual transactions.
Because the relationships go from the borough through to each fact table, filtering by a specific borough will automatically limit both datasets to only show the relevant rows. With that, Power BI can successfully filter multiple visuals at once, even though the data they are using might be living across tables.
What Power BI Means by Many-to-Many
As Microsoft writes in their Power BI documentation: “Many-to-many relationships occur when a value in one table can relate to multiple values in another—and vice versa.”
Essentially, Power BI cannot treat one side as a “lookup” table, and the other as detailed data.
This relationship is technically allowed, but comes with big downsides. Mainly, Power BI will not be able to determine how filters work if there are duplicates of the data in each table. There’s simply no clear path for the data to flow through!
Going back to our previous example, if dim_borough and fact_council_spend had a many-to-many relationship, it would mean both tables have multiple rows all for the same borough.
There would no longer be a single, unique row for a given borough. And without it, Power BI won’t be able to filter based on boroughs.
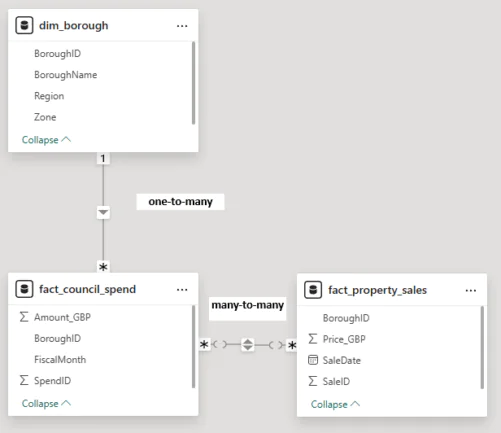
If we move things around a little, and connect dim_borough to fact_council_spend, then connect that up to fact_property_sales we see a many-to-many relationship.
Power BI creates this because there is simply no shared lookup table controlling how the data between them connects. Instead, Power BI is trying to match any spending records to property sales, which are not unique – and that’s how we get many-to-many.
Why Many-to-Many Relationships Appear
Now we know they can cause a problem, but why do Many-to-Many relationships crop up?
Usually it’s just because of the data you’re importing!
Often the data you get is a very wide table in Excel, and it works fine there – but not in Power BI. Everything is in one place, and when it’s split up into separate tables later, the joins don’t line up neatly.
Other times, descriptive information in your import is getting repeated across several tables. Fields like names, categories or labels are appearing in several places, and Power BI can’t work out which table should be the main reference point.
The reality of the situation is that Power BI is not doing anything wrong, but there are issues further up in the pipeline.
If your data model has a many-to-many relationship, then it’s telling you there isn’t a single clear path to follow the data through.
Why Many-to-Many Is Usually a Red Flag
So something is structured wrong in your data, but why does that actually matter?
Well, you’ll see if you try and build with a bad foundation!
In Power BI, this type of relationship causes:
- Confusing filters – slicers behaving inconsistently
- Unreliable totals – numbers look right in isolation but don’t total correctly
- Complex DAX – formulas become harder to write and harder to explain
- Slower models – Power BI is constantly struggling to trace the data properly, causing huge performance issues
- Harder maintenance – a little change will affect the entire model and possibly break all your visuals!
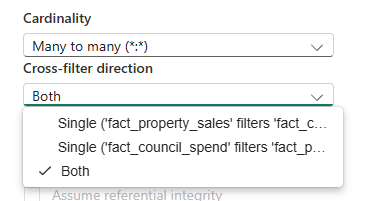
If you really need to just put a plaster on this issue without fixing the underlying flaws, bi-directional filters are your best call.
This will make your report appear to work, your slicers will suddenly start affecting several visuals, and totals might look closer to your expectations.
However, it’s just hiding the real issue instead of fixing it and makes the model harder to maintain.
Common Scenarios & Better Approaches
1 – Fact-to-fact linking
Before: Two Fact tables are connected directly, for example linking Activity Logs to Support Tickets. This creates unclear filtering.
After: Separate the Facts and connect them through shared Dimension tables such as Date, Borough, or Entity using one-to-many Cardinality.
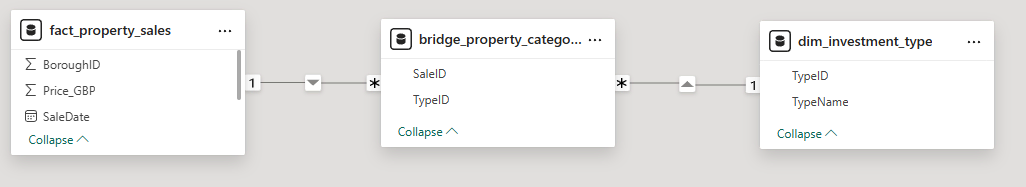
2 – Multicategory attributes
Before: A single table stores multiple categories per record, forcing a Many-to-Many relationship with a Dimension table.
After: Introduce a Bridge table that maps records to categories, allowing each table to keep a controlled one-to-many relationship.
3 – Attendance or transactional data
Before: Attendance or event-level records are joined directly to summary tables, causing duplicate counts and incorrect totals.
After: Store attendance or events as a proper Fact table and relate it to Dimensions like Date, Person, or Location using a Star Schema.
When Many-to-Many Can Be Valid
There are legitimate use cases where Many-to-Many relationships are required, but they are rare and intentional.
In these situations, the relationship isn’t just a shortcut. Valid many-to-many models usually include:
- A dedicated Bridge table that sits between the Fact and Dimension tables
- Explicit Grain definition for the Bridge table, usually one row per valid pairing
- Documented filter behaviour, so report users understand how slicers affect results
- Intentional architectural design, not a shortcut to fix an error
These models are engineered carefully. They don’t appear by accident, and they are actually built by design rather than discovered later down the line!
Final Recommendation
Power BI is all about clarity and predictability.
One-to-many Relationships, whole-number Surrogate Keys, and a well-defined Star Schema give it the structure it needs to work. That means applying filters, running efficiently, and producing results you can have faith in.
When you see a many-to-many relationship, treat it like a signal to pause whatever you are doing, and go back and review the model. Look at each table, separate facts from dimensions, and fix the underlying structure that you are building upon.
Only once the model is clear, Power BI can do what it was designed to do!


- Facebook: https://www.facebook.com/profile.php?id=100066814899655
- X (Twitter): https://twitter.com/AcuityTraining
- LinkedIn: https://www.linkedin.com/company/acuity-training/