
Excel Training for Data Analysts: Picking the Right Course
Contents
Data analysts today work in fast-paced, data-driven environments.
Whether you’re cleaning data, building dashboards, or automating reports, Microsoft Excel remains the foundation of modern analytics.
But learning Excel effectively, and in a way that applies directly to analyst workflows, can be a challenge.
That’s why we’ve designed our Excel Training for Data Analysts, giving you flexible and efficient learning paths that deliver results fast.
Why Data Analysts Need Advanced Excel Skills
Data analysts are expected to turn large, messy datasets into clear business insights.
While tools like Power BI, SQL, and Python are powerful, Excel is still the daily engine for most analysis in UK businesses.
Excel helps by:
- Cleaning and transforming raw data from multiple sources
- Automating reports and dashboards using Power Query and macros
- Performing what-if and scenario modelling for forecasting
- Analysing KPIs quickly using PivotTables and slicers
- Sharing results easily with stakeholders who already use Excel
In short, Excel reduces friction and provides the fastest route from data to decision.
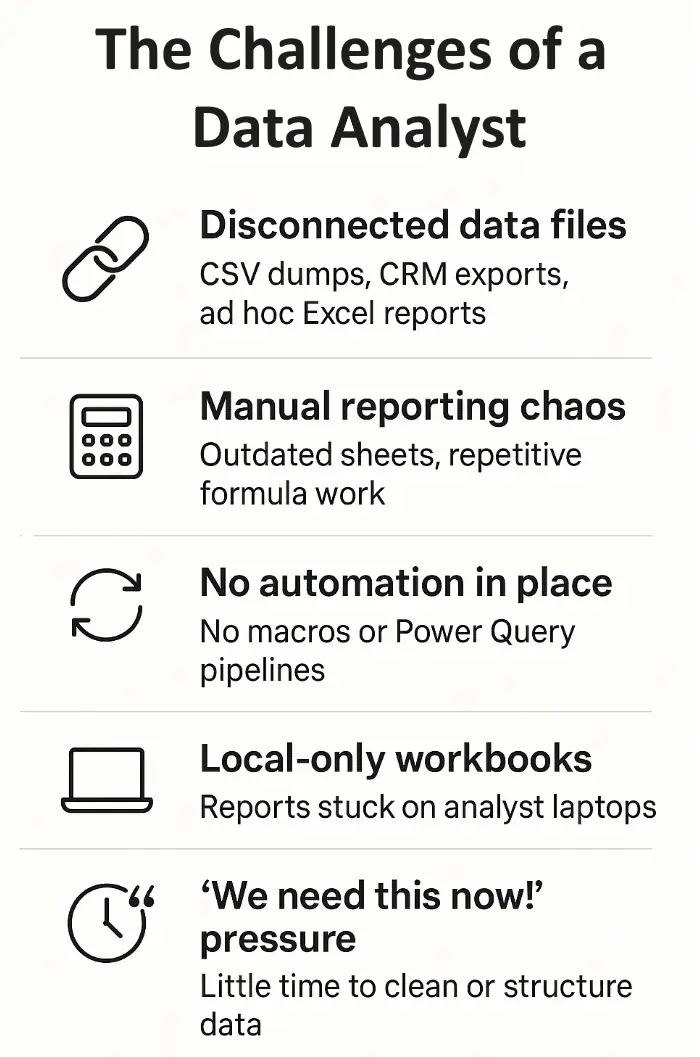
The Challenges Data Analysts Face
Most analysts share the same frustrations:
- Disconnected data sources (CSV exports, finance systems, CRM files)
- Repetitive, error-prone reporting in outdated workbooks
- Limited automation — too much manual formula-editing
- Difficulty scaling reports or dashboards beyond their laptop
- Pressure from managers to deliver “insights now” without proper structure
Our training tackles these challenges head-on, ensuring every exercise is rooted in data-analyst use cases, not generic spreadsheet skills.
What You’ll Learn in Our Analyst-Focused Excel Training
Our course covers everything from advanced data handling to professional-grade dashboards, always tied to real analyst workflows.
1. Excel Foundations for Analysis
- Refresh key data-handling skills: structured tables, named ranges, best practices
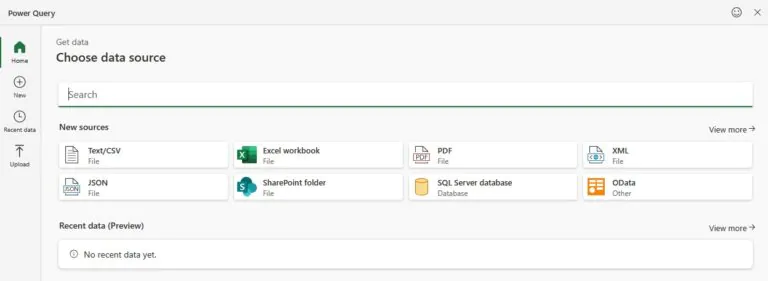
- Learn to import and clean large datasets using Power Query
- Understand how to build repeatable analysis processes instead of one-off sheets
2. Advanced Data Analysis & Modelling
- Use PivotTables, slicers, and Power Pivot to summarise and relate data
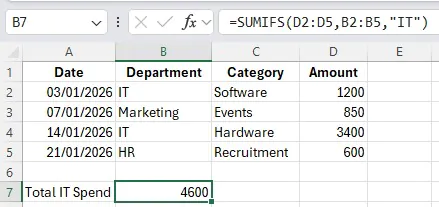
- Master key analytical formulas (INDEX-MATCH, XLOOKUP, dynamic arrays)
- Model what-if scenarios and use Solver for optimisation tasks
3. Automation & Efficiency
- Record and edit macros for repetitive reporting tasks
- Introduction to VBA for advanced automation
- Build efficient workbook structures that scale with your data
4. Dashboards & Visualisation
- Create professional-looking dashboards using charts, KPIs, and slicers
- Combine Power Query + PivotTables for interactive reporting
- Learn design principles for presenting data clearly and persuasively
5. Analyst Productivity Tools
- Speed up workflow with shortcuts, named ranges, and dynamic formulas
- Use new Excel 365 features (dynamic arrays, LET, LAMBDA)
- Integrate Excel with Power BI or SQL for larger-scale analytics
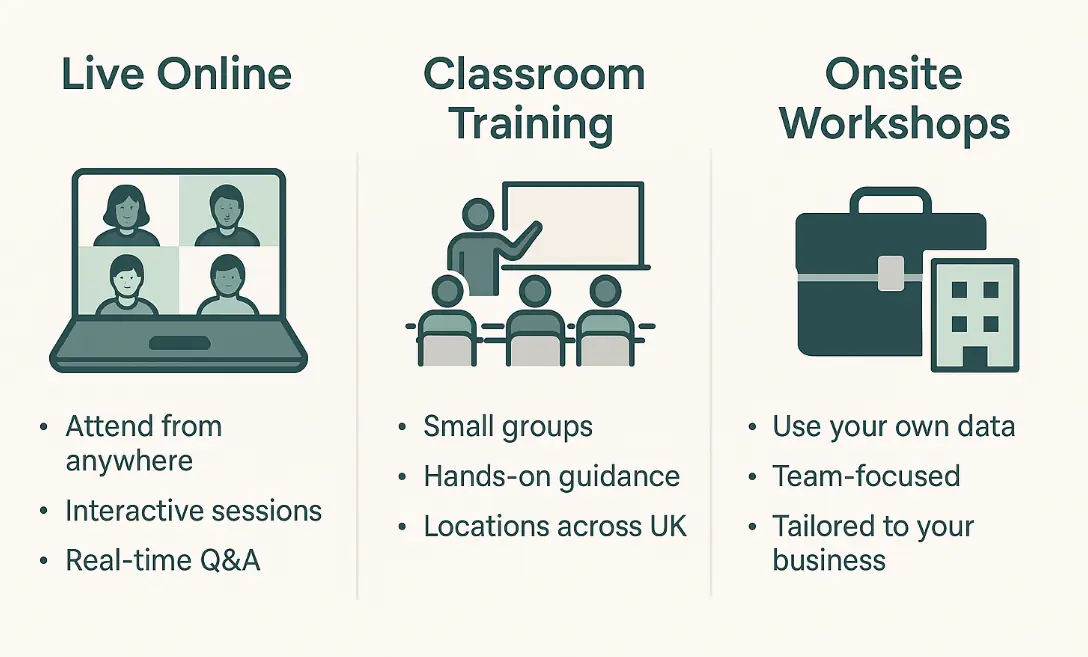
Flexible Learning Paths for Data Analysts
We know every analyst’s schedule is different. That’s why we offer multiple learning formats:
- Instructor-led online training – live, interactive sessions from anywhere
- Classroom training in London & across the UK – in-person, small groups
- Bespoke onsite workshops – bring your own data and build reports live
This way, you can pick the learning path that fits your workload, team size, and goals.
Trainer Insight
Many analysts try to master every Excel feature at once and quickly get overwhelmed.
Our trainers recommend starting with one high-impact workflow – for example, building a reusable Power Query pipeline for monthly reporting.
Once that’s working, it’s much easier to layer on automation, dashboards, and VBA.
In our experience, focusing on a single “quick win” accelerates confidence and long-term adoption far more effectively than trying to learn everything at once.
Real-World Analyst Use Cases
During training, you’ll build solutions like:
- Performance Dashboards: analyse monthly KPIs using PivotTables & slicers
- Data-Cleaning Pipelines: automate raw data imports with Power Query
- Forecast Models: apply scenario analysis to predict revenue or costs
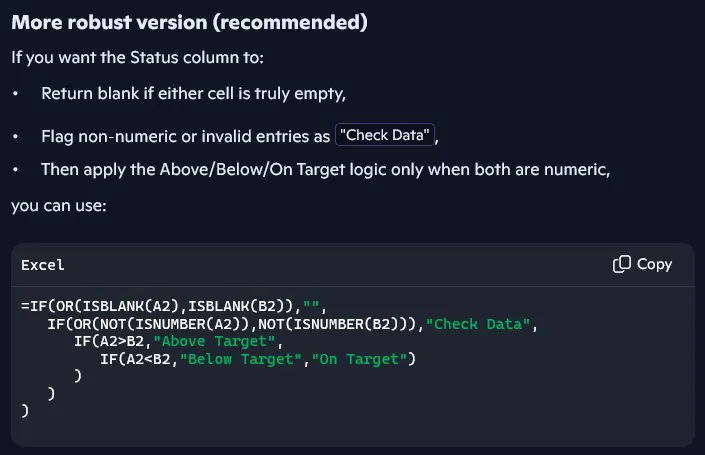
- Error-Checking Systems: use auditing formulas to validate large datasets
- Macro-Driven Reports: automate repetitive weekly or monthly reporting
Every module is practical, so you leave with tools you can apply immediately to your data-analysis work.
How Acuity Training Compares
Excel courses are all over these days – so why pick us?
Well, most Excel courses just teach formulas and formatting.
Ours focuses on analyst-level applications.
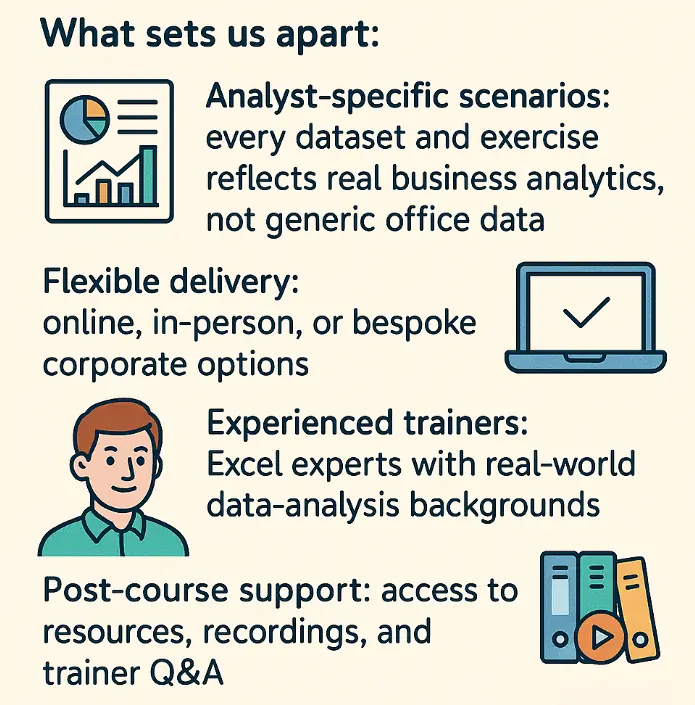
What sets us apart:
- Analyst-specific scenarios: every dataset and exercise reflects real business analytics, not generic office data.
- Flexible delivery: online, in-person, or bespoke corporate options.
- Experienced trainers: Excel experts with real-world data-analysis backgrounds.
- Post-course support: access to resources, recordings, and trainer Q&A.
- Accredited training: CPD-recognised certificates for professional credibility.
Who This Training Is For
These courses are ideal if you are:
- A data analyst or business analyst working with Excel daily
- A finance professional who needs stronger analytical skills
- A marketing or operations analyst reporting KPIs and trends
- A consultant or freelancer delivering dashboards for clients
- Or anyone transitioning into data analytics who wants a strong Excel foundation
Conclusion
Data analysts operate in high-pressure, insight-driven roles.
Learning Excel with a data-analyst focus gives you the tools to work faster, automate smarter, and communicate insights clearly.
With Acuity Training’s flexible learning paths, practical case studies, and real-world datasets:
You’ll finish feeling confident in your ability to turn data into decisions – not just spreadsheets.
Start today and make Excel your professional advantage.
Analyst FAQs
Do I need prior Excel experience?
No. We offer both beginner and advanced options. Analysts new to Excel can start with foundations before progressing to advanced modules.
Can I bring my own data?
Yes. Many analysts find it most valuable to use their own datasets during training to solve live business challenges.
Is this training accredited?
Yes. Our Excel courses are CPD-Certified and issue a certificate of completion.
Where is training available?
Online, and in person in UK Wide – including London, Manchester, Birmingham. We also do on site visits by request.
- Facebook: https://www.facebook.com/profile.php?id=100066814899655
- X (Twitter): https://twitter.com/AcuityTraining
- LinkedIn: https://www.linkedin.com/company/acuity-training/