
Decoding DAX Query Plans: How to Detect and Fix Query Bottlenecks
Contents
Every Power BI developer knows the feeling.
Your report looks great, but once people start clicking around, it slows down.
Charts take forever to load, and you’re left wondering what’s wrong.
The problem isn’t just that it’s slow. It’s that you don’t know why.
Most of us try to guess. Maybe CALCULATE is too heavy. Maybe FILTER or SUMX is the issue. But guessing doesn’t get you anywhere.
DAX Query Plans take out the guesswork. They show exactly how Power BI runs your query; specifically, which part does the work and where it gets stuck.
Once you see what’s really happening, you can fix the problem instead of guessing.
What Happens When a Visual Loads
When you click a slicer or open a page, Power BI doesn’t just “run DAX.” Each query goes through two engines:
- Storage Engine (SE): Reads data from VertiPaq or DirectQuery sources, usually working in compressed, columnar form.
- Formula Engine (FE): Handles calculations, logic, and transformations after data is retrieved.
Ideally, most work happens in the Storage Engine. It’s optimized for speed and can process data in bulk.
The Formula Engine, however, works row by row.
If your DAX forces the FE to do heavy iteration, your visuals will slow down fast.
Knowing which engine dominates a query is key to optimizing performance.
The Tools You Need
You’ll use Performance Analyzer in Power BI and DAX Studio to inspect query plans.
DAX Studio is a free third-party tool for analyzing query performance, which you can download at daxstudio.org/downloads.
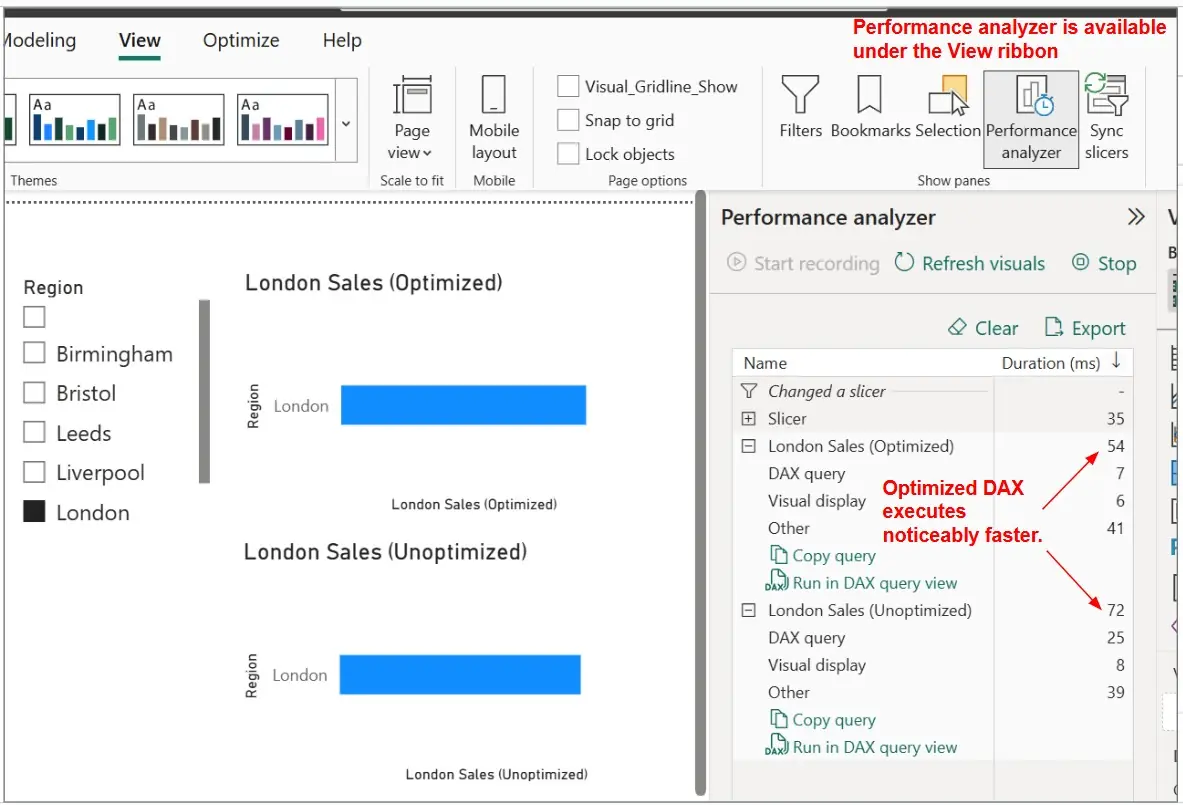
- In Power BI Desktop, open View → Performance Analyzer.
- Start recording, then refresh or interact with the slow visual.
- Copy the generated DAX query.
- Open DAX Studio and connect to your model.
- Enable Server Timings to see FE and SE and Query Plan to see CallbackDataID.
- Paste the DAX query and check the performance.
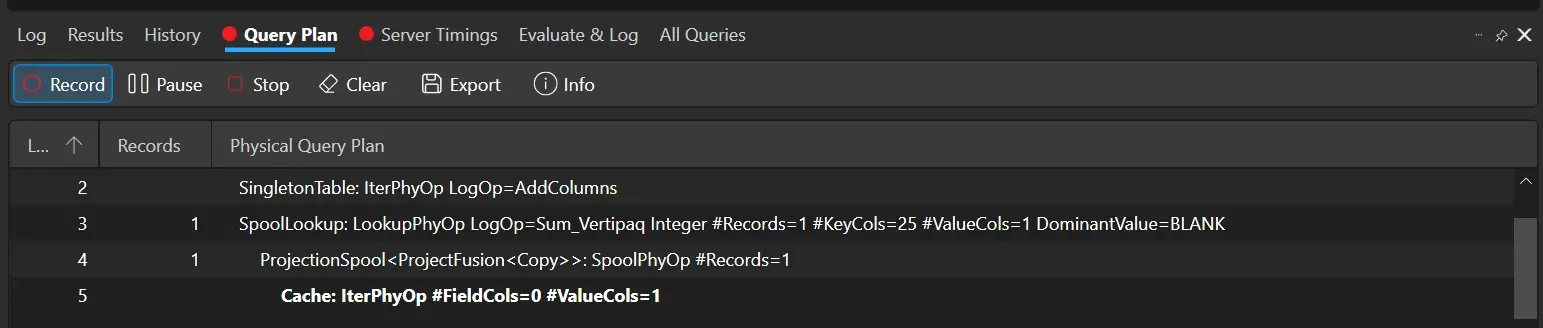
You’ll now see how long the Storage and Formula Engines took, how many callbacks occurred, and operations like VertiPaq Scan or Filter. Each operation tells part of the story.
Reading a Query Plan
A DAX query plan lists operations executed in sequence. Some common ones:
- Scan: Reads data from VertiPaq.
- Filter: Applies a condition to restrict rows.
- CallbackDataID: Triggered when the Formula Engine asks the Storage Engine for more data which is a major red flag.
A fast query plan shows the Storage Engine doing most of the work with minimal callbacks. Too many CallbackDataIDs mean the Formula Engine is looping through data instead of pushing operations down to the Storage Engine.
Example: Finding the Bottleneck
Let’s say we have a sales data containing transactions from stores across different UK regions.
A Power BI developer writes this DAX measure to calculate total sales for London:
SUMX(
Sales,
VAR CheckRegion =
CALCULATE(
COUNTROWS(Sales),
FILTER(ALL(Sales),
Sales[Region] = “London”))
RETURN
IF(CheckRegion > 0, Sales[Amount], BLANK()))
Running this DAX measure, he tested the performance with the built-in analyzer in Power BI.
The measure works, but performs terribly at scale. Measures often have a hidden cost to performance in Power BI! Diving down further, he analysed the performance in DAX Studio.
The query plan reveals:
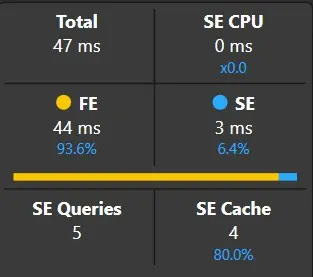
- Storage Engine: 3 ms (data retrieval)
- Formula Engine: 44 ms (row-by-row calculations)
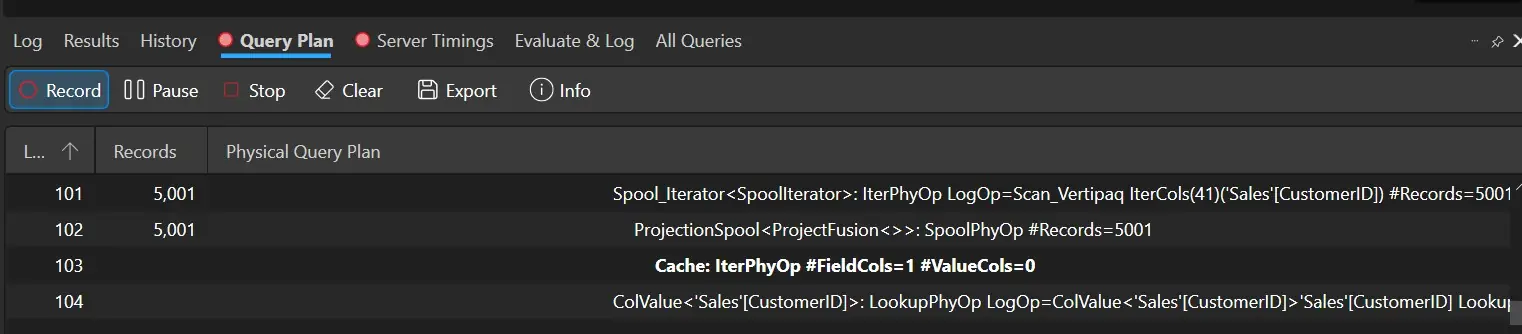
- 104 CallbackDataID operations
The problem? SUMX is forcing the Formula Engine to iterate through all rows, calling FILTER and CALCULATE for each one.
Those callbacks represent the Formula Engine repeatedly requesting data from the Storage Engine.
The fix is simple: rewrite the measure, so the Storage Engine handles the filter natively:
CALCULATE(
SUM(Sales[Amount]),
Sales[Region] = “London”)
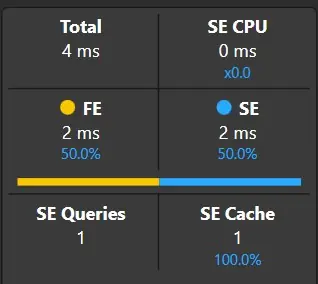
The new plan shows one VertiPaq Scan with a filter, dropping Formula Engine time from 44 to 2 ms and CallbackDataID from 104 to 5, which is a significant improvement.
Small syntax changes can yield massive performance gains, especially at larger datasets.
Trainer Insight: At Acuity Training, we teach advanced Power BI students to use DAX Studio as a standard diagnostic tool; not just when things go wrong, but as part of their development workflow.
By analyzing query plans in live sessions, students learn to identify performance bottlenecks through evidence rather than guesswork, a skill they can immediately apply in real-world projects.
Spotting Bottlenecks
Once you know what to look for, patterns become clear.
| Symptom | Likely Cause | Fix |
| High Formula Engine time, low Storage Engine time | Iterators (SUMX, FILTER) over large tables | Replace with CALCULATE or pre-aggregations |
| High Storage Engine time | Large DirectQuery data or missing aggregations | Enable query folding or add aggregation tables |
| Many CallbackDataID operations | Nested or dynamic filters | Simplify DAX logic and reduce context transitions |
In short:
- If Formula Engine time is high → your DAX is doing too much.
- If Storage Engine time is high → your data model or source is the problem.
Fixing and Testing
Once you spot the bottleneck, test changes one at a time. Don’t overhaul everything blindly. Measure, adjust, and compare.
Checklist for tuning:
- Use Server Timings for accurate query duration. Visual render time can mislead.
- Simplify DAX: Replace iterators with aggregation functions when possible.
- Optimize the model: Follow star schema design, remove unnecessary relationships, and pre-summarize large datasets.
- Use variables: Prevent repeated calculations and make the plan cleaner.
Every time you tweak a measure, re-run it in DAX Studio. Watch how Formula and Storage times change.
Best Practices for Query Plan Analysis
- Always benchmark. Use Server Timings for consistent results.
- Model first, DAX second. Even the best-written measure can’t save a poor data model.
- Save your plans. If a report slows down after a refresh or schema change, comparing query plans helps you pinpoint the regression.
- Understand the split. The FE vs. SE divide is foundational. Mastering it will reshape how you think about DAX.
- Iterate slowly. Optimize one measure at a time so you know what truly helped.
Final Thoughts
Learning to read DAX Query Plans transforms how you approach Power BI. Instead of hoping your measures are fast, you’ll know why they are or aren’t. You’ll move from reacting to performance issues to preventing them.
To dig deeper, check Microsoft’s documentation on Performance Analyzer or our DAX Optimiser Tool to help learn best practices.
But theory only gets you so far. The real learning comes from practice. Open DAX Studio, grab your slowest query, and analyze it line by line. You’ll begin spotting inefficiencies instantly and your reports will start running like they should.


- Facebook: https://www.facebook.com/profile.php?id=100066814899655
- X (Twitter): https://twitter.com/AcuityTraining
- LinkedIn: https://www.linkedin.com/company/acuity-training/