
Using Data Dictionaries In Power BI
Contents
- 1 What Is a Data Dictionary?
- 2 Trainer Insight
- 3 Methods to Create a Data Dictionary in Power BI
- 4 Using External Documentation Tools
- 5 Automate Metadata Collection With DAX Studio
- 6 Embed the Data Dictionary in Your Report
- 7 Using INFO.VIEW function
- 8 Common Challenges and How to Overcome Them
- 9 Conclusion
Have you ever opened a Power BI report and felt overwhelmed by all the columns, measures, and tables?
It can feel like a guessing game trying to figure out what each field represents.
A well-built data dictionary eliminates that confusion, giving you clarity and confidence when exploring reports.
What Is a Data Dictionary?
A data dictionary ensures everyone understands your data the same way.
Misunderstood measures or columns can lead to errors, delays, and unnecessary questions about accuracy.
Stakeholders often interpreted measures differently, leading to confusion and report complaints.
While Power BI does not have a built-in data dictionary feature, creating one manually or with tools makes your reports clearer and more reliable.
It typically includes:
- Field Name – The exact name in your model
- Friendly Name – A simplified label for business users
- Data Type – Text, number, date, or other format
- Description – A short explanation or calculation logic
- Source Table – Where the field comes from
Why it helps:
- Improves understanding for new users
- Reduces errors caused by misinterpreted fields
- Makes your reports more transparent and professional
Trainer Insight
We’ve reviewed countless reports on our Power BI courses, and one thing that people always forget is the data dictionary.
It’s easy to assume field names are self-explanatory, but in practice, even experienced users get tripped up by unclear measures or duplicate-sounding fields.
Adding a simple dictionary page to your report makes it more user-friendly, professional, and far easier to maintain as your model evolves.
It’s one of those “small effort, big impact” upgrades we always recommend.
Methods to Create a Data Dictionary in Power BI
1 – Decide What to Include
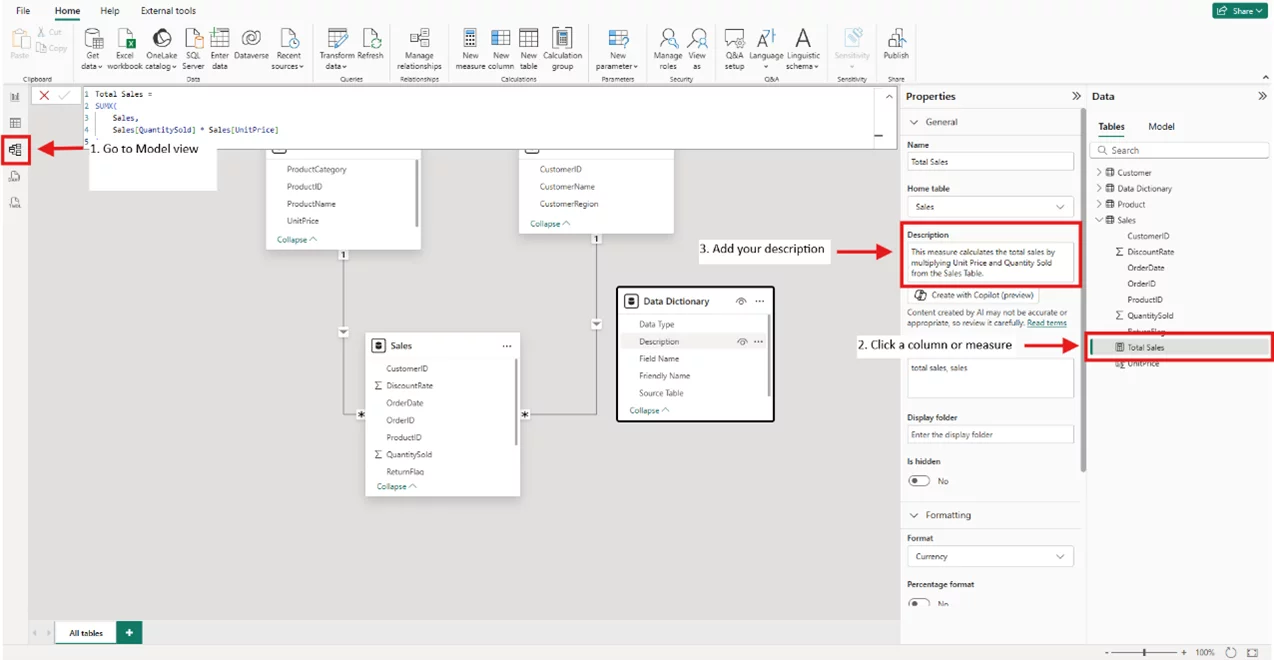
Focus on the essentials: Field Name, Friendly Name, Data Type, Description, and Source Table.
Optional items like KPIs or calculation notes can be added if useful.
- See the picture below on how to add more details to your columns and measures.
2 – Build a Manual Data Dictionary Table
This method works best for small datasets or demos.
- In Power BI Desktop, go to Home> Enter Data.
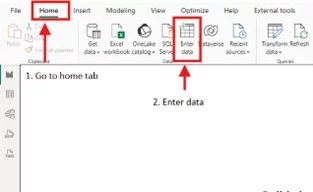
- Once you clicked on enter data, a window will pop up to create your table.
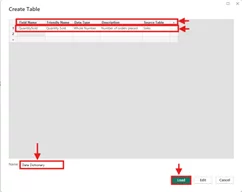
- Use a matrix visual on a separate page named Data Dictionary to display it.
Using External Documentation Tools
If you prefer to maintain your dictionary outside Power BI, you can use tools like Excel, SharePoint, or Confluence.
Pros:
- Easy to edit and share across teams
- Can include additional notes or links to procedures
- Useful for organizations with centralized documentation practices
Cons:
- Users must leave Power BI to view it
- Higher risk of version mismatches if not updated regularly
Automate Metadata Collection With DAX Studio
If your model has many fields:
- Connect DAX Studio to your Power BI file.
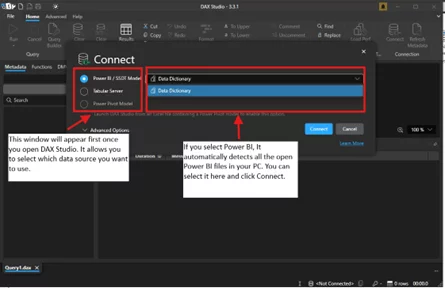
- Export the data model.
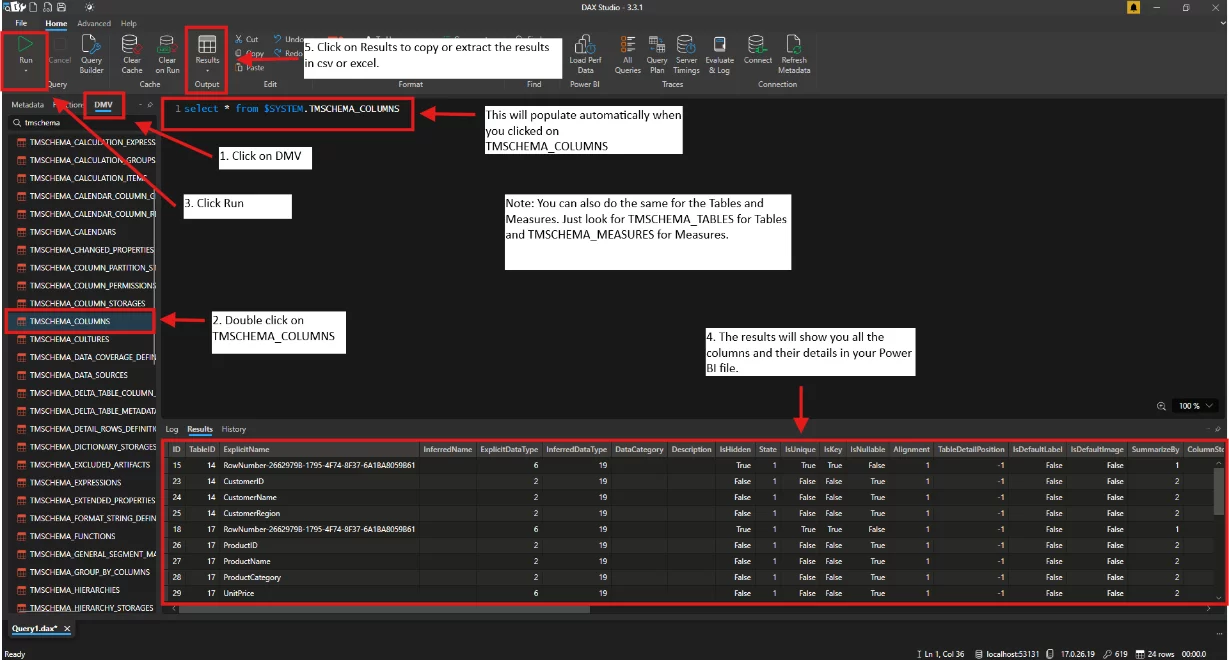
- Clean the exported files, add more details and descriptions, and import it back into Power BI as your dictionary table.
Embed the Data Dictionary in Your Report
To make it easy for users to access:
- Add a new page called Data Dictionary
- Use a matrix or table visual to list all fields
- Group by source table for clarity
- Highlight headers or use simple formatting for readability
- Optional: Use icons or subtle formatting to emphasize key fields
Using INFO.VIEW function
The INFO.VIEW function allows you to quickly view your model’s metadata without leaving Power BI.
You can also check Microsoft’s official info.view function documentation for guidance.
- See the image below on how to use the INFO.VIEW function.
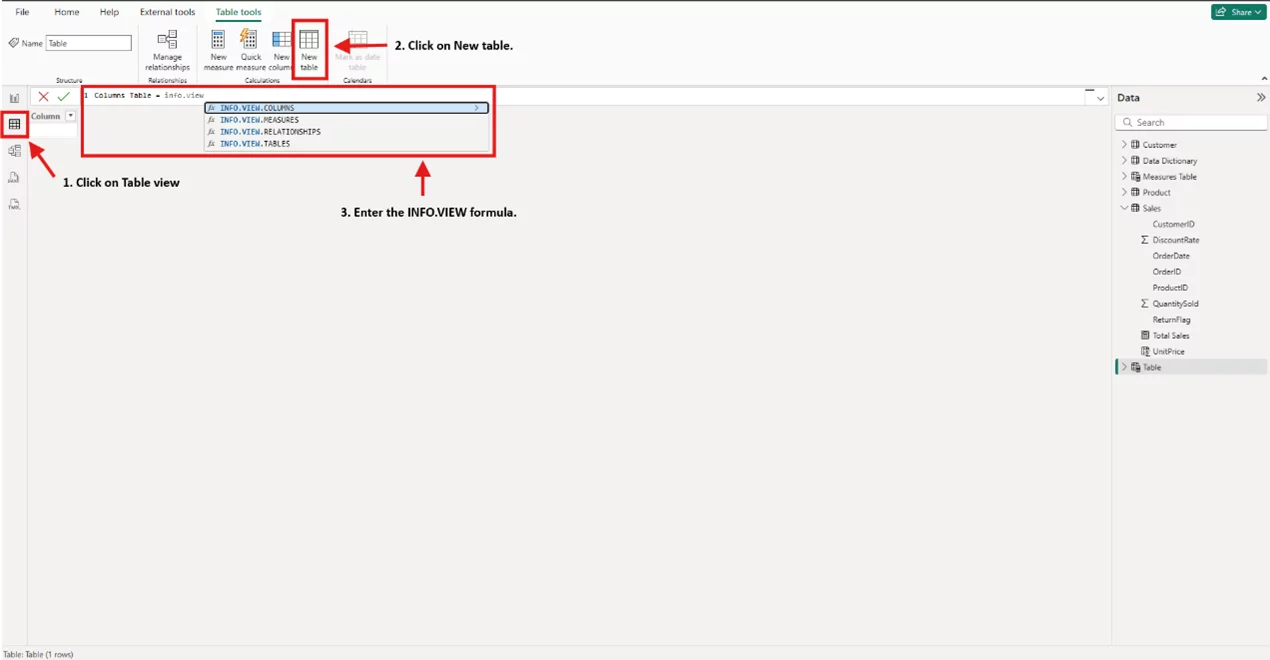
- After selecting the function, hit Enter to populate the data. You can now use this table to create another page for your Data Dictionary.

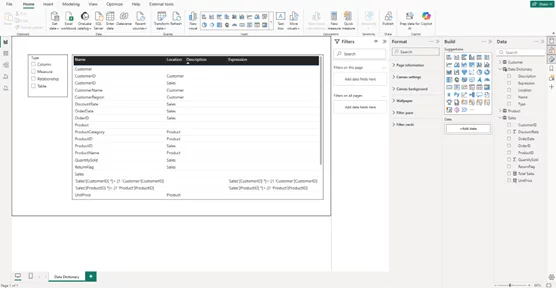
Once the table is loaded, you can now create a page for your Data Dictionary.
Using a Matrix visual and add the columns from the Data Dictionary table.
Best Practices
- Update the dictionary whenever new fields or measures are added (If you’re using a Manual Table or DAX Studio)
- Use consistent and business-friendly naming conventions
- Keep descriptions short and clear
- Embed it directly in the report for easy access
Common Challenges and How to Overcome Them
Challenge 1: The data dictionary becomes outdated quickly
Solution: Assign ownership of the dictionary to a specific person or role, and include it as part of your report update process.
Challenge 2: Multiple versions are floating around in different locations
Solution: Store the data dictionary in a shared, centralised location such as SharePoint or Teams, and reference that source consistently.
Challenge 3: Users don’t check the dictionary before asking questions
Solution: Embed the dictionary directly in the Power BI report so it’s always visible and easy to access during report exploration.
Conclusion
A Power BI data dictionary transforms confusing datasets into clear, trustworthy resources.
It makes collaboration easier, reduces misinterpretation, and ensures your reports are self-explanatory.
Start with a small manual dictionary, expand to automated methods as your models grow, and keep it up to date.
By doing so, you create reports that are not just powerful, but also easy to understand.


- Facebook: https://www.facebook.com/profile.php?id=100066814899655
- X (Twitter): https://twitter.com/AcuityTraining
- LinkedIn: https://www.linkedin.com/company/acuity-training/