
The Hidden Cost of Measures in Power BI
Contents
When you first start using Power BI, measures feel like magic. You type a quick SUM or CALCULATE, and your visual updates instantly.
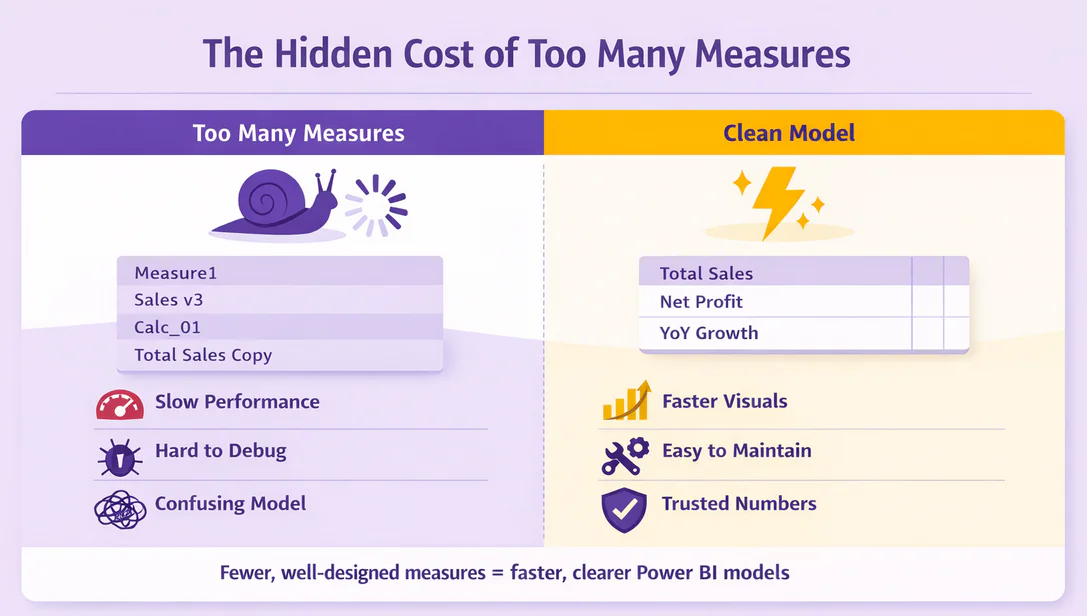
It’s exciting, until your model starts filling up with dozens, maybe hundreds, of measures. Before you know it, the model is slow, confusing, and fragile.
Most people don’t realise that just because your numbers are correct doesn’t mean your model is healthy.
This article will show you why measures matter, when they become a problem, and how to keep your Power BI models clean and fast.
What a Measure Really Is
As Microsoft’s official measure documentation says: “Measures calculate a result from an expression formula (DAX)”. Unlike columns, which store data, measures calculate results whenever a visual updates.
This dynamic behaviour is powerful. It allows numbers to respond to filters, slicers, and drill-downs, but it comes with a cost. Every measure adds extra work for Power BI every time someone interacts with the report.
When you add a column, the data loads once and sits ready. When you create a measure, Power BI has to recalculate it every time someone clicks, filters, or drills down.
Both get the job done, but one takes more time each time you click.
Why Measures Multiply Quickly
One measure often becomes ten. Ten become fifty. How does this happen?
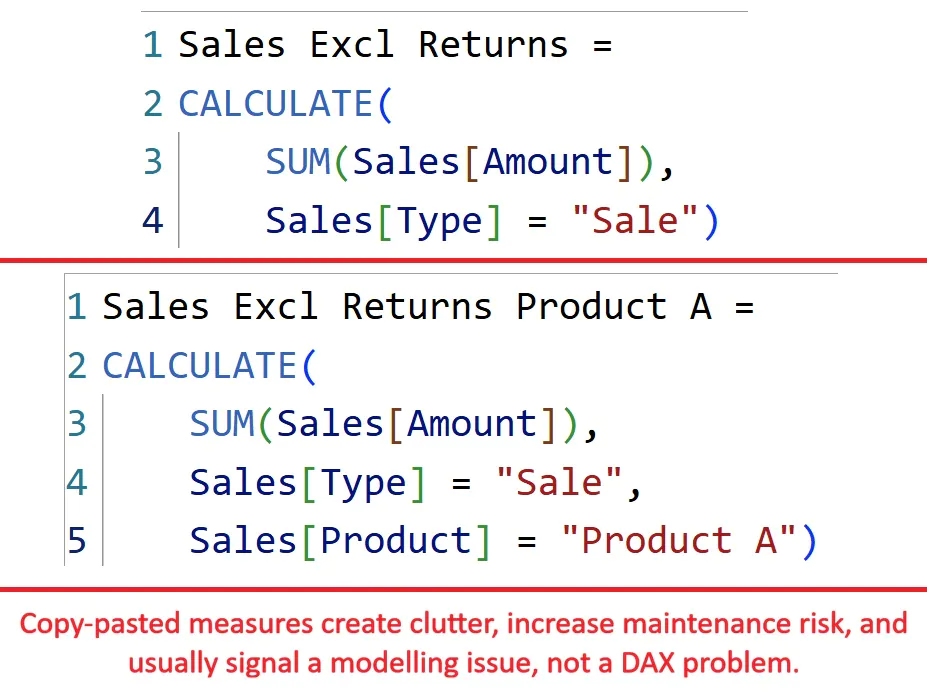
One-off business questions: Someone asks for a visual with “sales excluding returns”, so you create a measure. Next week they want “sales excluding returns for Product A”, and that needs another measure.
Copy-paste variations: You tweak a measure slightly instead of reusing logic. Soon you have five almost identical calculations.
AI-generated measures: Tools like Copilot can create measures fast, but they don’t clean up or optimize your model.
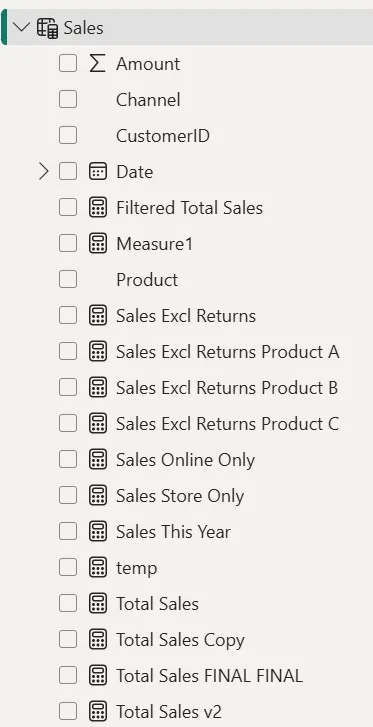
Messy naming: Names like “Measure1” or “Total Sales v3” pile up because nobody knows which ones are safe to delete.
On our Power BI workshops in London, we teach real restraint when it comes to measures, and explain in depth when you actually need to use one.
Then your end result becomes a measure table that works on paper, but is a slow mess in the backend.
The Hidden Costs of Too Many Measures
Performance is the most obvious cost. Complex measures with filters, SUMX, or DISTINCTCOUNT really slow down visuals, especially on large datasets.
But what else gets effected?
First of all, debugging gets harder for the whole team. If you have 7 measures for “total sales”, then which one is actually correct?
Then comes the cognitive overload. When going through a report with 50 different measures, analysts will have to spend a lot of mental energy on
- Harder debugging: Which of the 7 “Total Sales” measures is actually correct?
- Cognitive overload: Analysts spend more time hunting measures than writing DAX.
- Unnecessary clutter: Old measures stay forever because nobody knows if they can be deleted.
- Slower onboarding: New teammates inherit a model they can’t navigate.
Performance issues might trigger a review with your coworkers, but trust issues will do real damage to their confidence in you as a Power BI developer.
Common Measure Patterns That Cause Problems
Some measures signal deeper problems:
- Tiny variations of the same calculation: Total Sales, Total Sales (Excl Tax), Total Sales (Excl Returns). Multiple similar measures usually mean the model structure needs improvement.
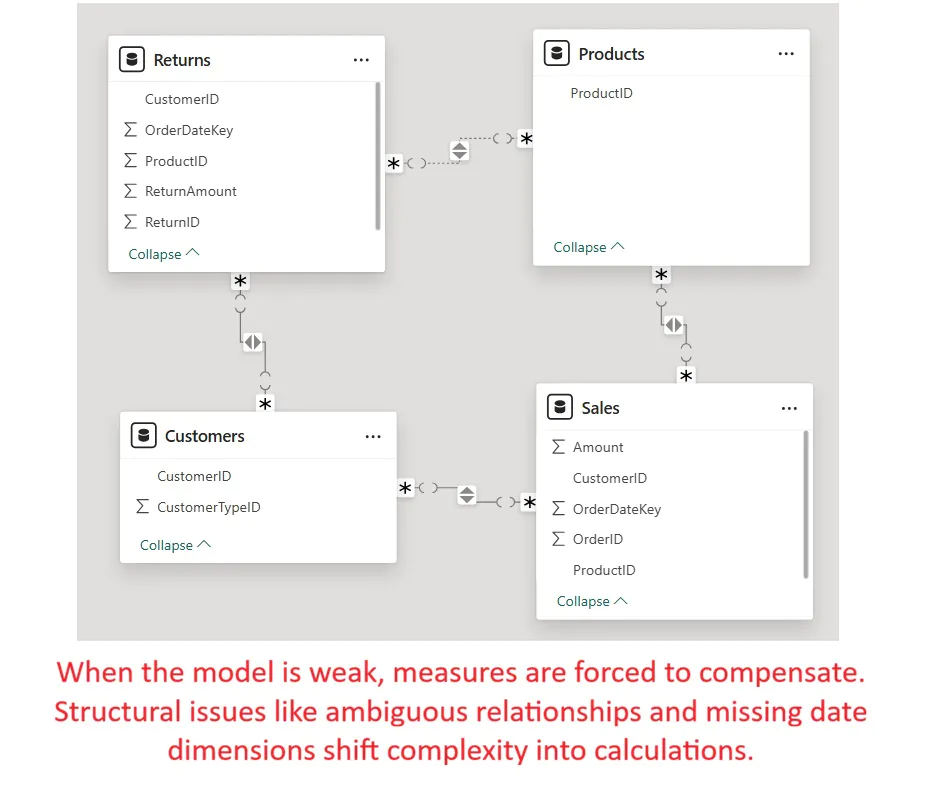
- Measures fixing weak models: Measures that exist only to bypass relationship issues or missing dimension tables.

- Heavy use of FILTER or DISTINCTCOUNT: These functions scan entire tables and run slowly. Our DAX Optimiser tool can teach you more efficient ways to get the same result.
- Logic in visuals instead of the model: Hardcoded filters create hidden dependencies that break when the model changes (Microsoft Learn – Optimize your data model).
These patterns don’t just slow your report, they make the model fragile and confusing! If your data looks like this, then something is wrong.
How to Tell If Measures Are Hiding a Modelling Issue
Watch for these red flags:
Too many measures for simple data? If you only have a few tables but more than 5 measures in each, something is off.
Measures that only work for one visual? You probably have too specific of a measure, and it’s acting like a workaround – not a solution.
Are you afraid of editing or deleting a measure? Then you (and probably others) don’t really understand the measure, which doesn’t address the core issue.
Lots of similar looking measures? You’re probably missing dimensions, or have a weak table structure.
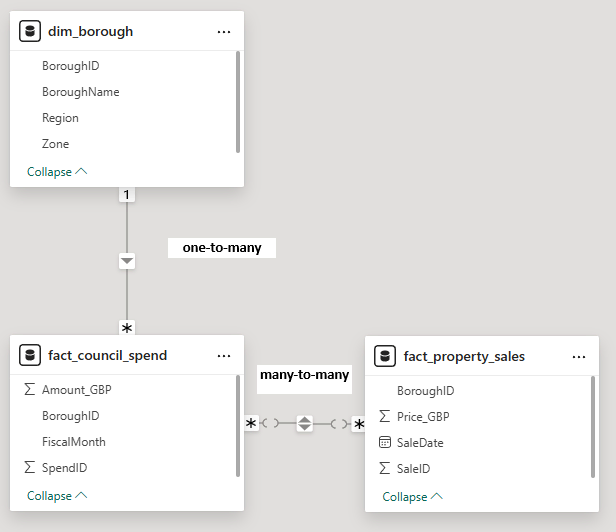
Often, improving the model such as adding proper date tables, bridge tables, or flattening snowflake schemas eliminates dozens of unnecessary measures.
Quick Tips: Keep Measures Healthy
- Start simple: Only create measures you really need.
- Name carefully: Clear, consistent names save headaches later.
- Check the model first: Sometimes adding a table or relationship eliminates the need for extra measures.
- Reuse, don’t duplicate: Avoid copy-pasting similar DAX. Adjust the logic to be dynamic.
- Measure for logic, not patching: Don’t use measures to fix structural issues.
Final Recommendation
Fewer, well-designed measures always win.
Strong models reduce the need for complex DAX. When your fact and dimension tables are structured properly, measures become simple and reusable.
Before creating a new measure, ask yourself: Do I really need this, or am I fixing a model problem?
Your reports will run faster, your DAX will be clearer, and your future self will thank you.


- Facebook: https://www.facebook.com/profile.php?id=100066814899655
- X (Twitter): https://twitter.com/AcuityTraining
- LinkedIn: https://www.linkedin.com/company/acuity-training/