
Building A Decision Model In Excel
Contents
We all know that Excel is an amazing tool to organise, calculate, analyse and visualise data. Experiences users know you can combine all these features to help make decisions!
It can help you compare between different options, test assumptions you or stakeholders have made, and understand the potential trade-offs involved in a business decision.
That’s what a decision model is for.
What A Decision Model Is
A decision model is designed to help you think through and predict the outcomes of a particular choice, they don’t predict the future! For example, imagine you’re deciding whether to hire a new employee, or keep the current staff as is. A decision model can’t tell you what your profits will be in a year’s time, but it can tell you:
- A teams expected workload for the coming year
- The cost of hiring a new employee to the business
- How long employees tend to take before becoming productive
It helps you get all the information you need to make an informed decision. We aren’t predicting the future, just thinking it through in depth.
So, how can we get started?
Step 1 – Plan The Decision Model
Before we open up Excel, think about the decision you are trying to make, and what data you have at hand. This is a key part of our Excel training in London, you need to gather your key information before rushing into making a spreadsheet!
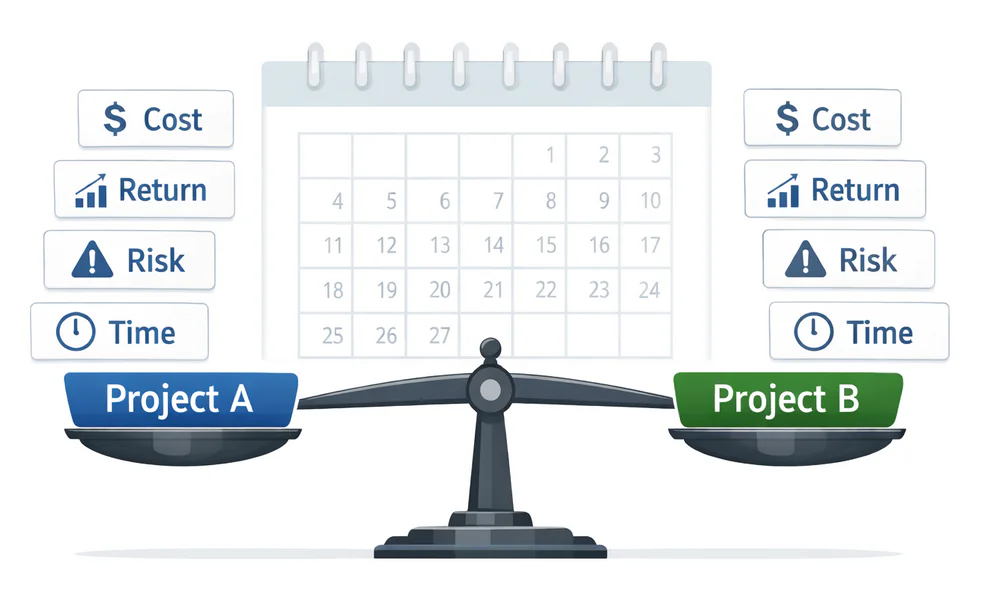
For this example, we are going to be picking between two projects: Project A and Project B.
Right now we aren’t worried about formulas or layouts, just what the options are, and what information we are using to compare them.
For our projects, we have data covering:
- Costs
- Expected Returns
- Time To Complete
- Risk Level
- Resource Requirements
We also have some broader company-level financial information that will help shape the decision: current savings, overall revenue and other financials. We can’t just compare two projects against each other, we need to also consider the context of the company’s current financial position.
Step 2 – Add The Data
Let’s start laying out the options we are comparing, give each project its own column, and the projects are easy to compare side by side. We aren’t calculating anything right now, just building up our framework, so the rest of the model has data to reference.
For our example, we’ve added the data for each project, as well as the company financials we have.
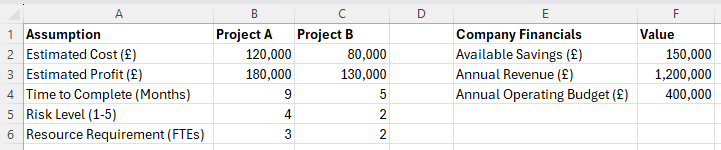
The key here is to label things clearly, your model is meant to help make decisions, so you’ll inevitably have to share it with others. Make sure all the labels are self-explanatory, and don’t be too wordy!
Step 3 – Build Simple Calculations
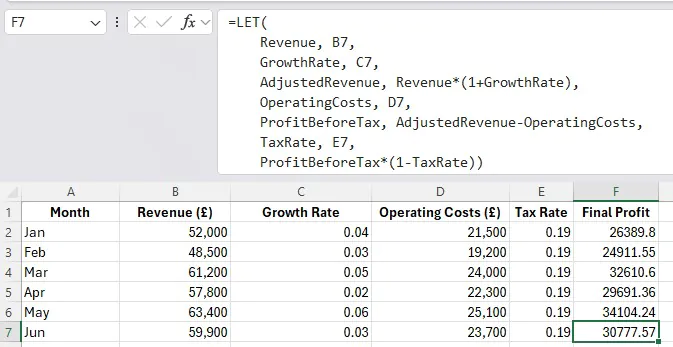
With the data in place, you can start calculating some outcomes. Keep them simple, readable and easy to follow. For example here, we might want to look at the Net return (returns minus costs), and adjust the figures based on risk, as well as our current finances.
Don’t make them too complex! There are new Excel functions in 2026 that are often much more efficient than traditional ones.
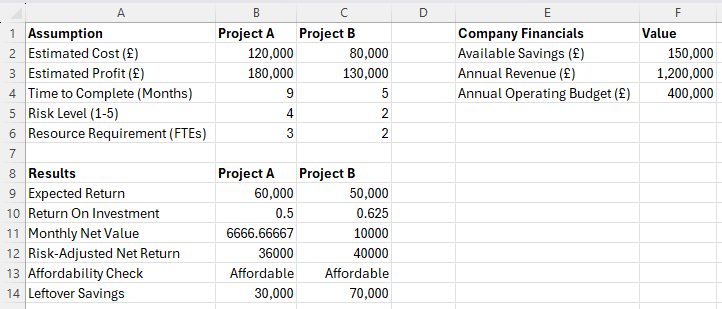
Here’s a quick breakdown! We have:
Expected Return: Estimated Profit – Estimated Cost
In Excel: =B3-B2
Return On Investment: (Estimated Profit – Estimated Cost) / Estimated Cost
In Excel: =(B3-B2)/B2
Monthly Net Value: (Estimated Profit – Estimated Cost) / Time to Complete
In Excel: =(B3-B2)/B4
Risk-Adjusted Net Return: (Estimated Profit – Estimated Cost) * (1-(Risk Level / 10))
In Excel: =(B3-B2)*(1-(B5/10))
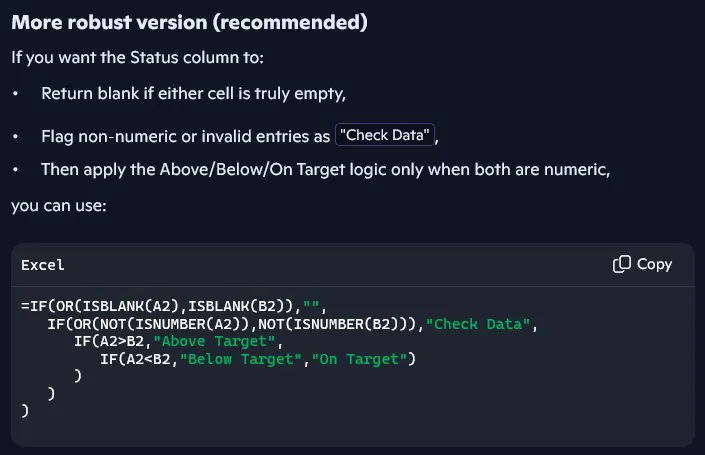
Affordability Check: If Estimated Cost < Available Savings
In Excel: =IF(B2<=$F$2,”Affordable”,”Not affordable”)
Leftover Savings: Available Savings – Estimated Cost
In Excel: =$F$2-B2
Step 4 – Compare The Results Side By Side
Now we have our results side by side, we can easily compare them. Apply conditional formatting to each column, and it will quickly highlight which project is doing best where.
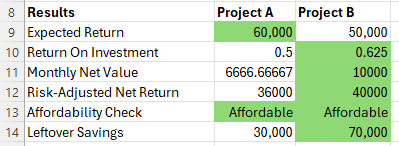
Back to our example, while Project A looked like it might have the best return, it performs worse in every other metric! Project B might pull in less money, but is less risky, while still generating good return for the initial investment. Using conditional formatting here helps you and other stakeholders see the right choice at a glance – and they can dig deeper if they like!
Step 5 – Adjusting The Decision Model
One of the biggest advantages of the model we have created is how easy it is to adjust. Since the results for each project are using cell references & conditional formatting, we can adjust the initial assumptions.
In real life projects, things like time to complete, resource requirements and costs will change on the fly, and you’ll need to be ready!
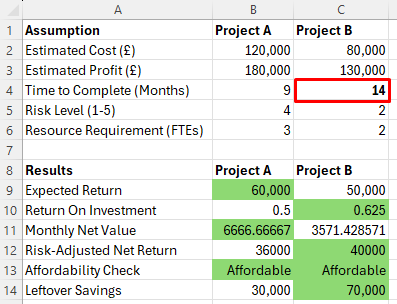
Here I adjusted the time to complete, and suddenly the decision is a little more nuanced. Project A will bring in more money on a monthly basis, which might just change the final decision!
Conclusion
A decision model isn’t about predicting the future, it’s about providing a framework that helps support decision-making.
It helps you understand the consequences of different choices, presents a simple model for you and stakeholders to take a look at, and lets you adjust it if need be!
Used this way, Excel becomes far more than a spreadsheet.
It becomes a decision support tool.

- Facebook: https://www.facebook.com/profile.php?id=100066814899655
- X (Twitter): https://twitter.com/AcuityTraining
- LinkedIn: https://www.linkedin.com/company/acuity-training/