
4 Overused Excel Bad Habits That Slow People Down
Contents
Whether it’s delegates, trainers, or consultants – I spend a lot of time with Excel users!
And to be honest, I see a lot of the exact same habits cropping up again and again.
They slow people down, make spreadsheets harder to maintain, and even just harder to understand. And like most bad habits, people don’t even realise there are better solutions!
So here are the top 4 bad habits I see in Excel users that look productive on the surface, but are actually holding people back.
1 – Building Everything From Scratch, Every Time
Let’s start with the biggest one, by far.
Someone receives a weekly report – they clean it, they format it, they build formulas and they produce a summary. Then next week, they do the exact same thing again from the very first step.
I see this all the time.
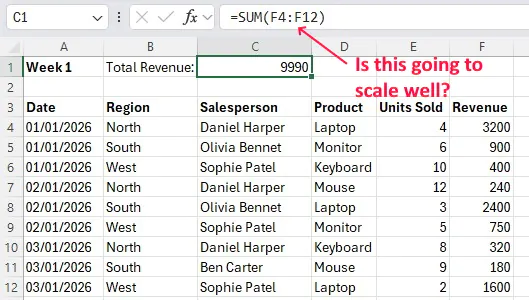
Here I built a much simpler version, just using a simple SUM to calculate the total revenue, but a real world dataset is going to have thousands of rows and columns, and might need around 30 calculations each time.
Instead of building a process, people rebuild the spreadsheet every time the data arrives. The only reason it feels productive is because you are keeping yourself busy, but it’s an extremely slow way to go about reporting!
Good Excel users don’t just complete tasks, they build systems. If any task you get is recurring, then you can make a better framework. It could be making proper tables, using Power Query, or even just structuring your workbook properly so new data can drop straight in.
If you’re doing the same steps manually each week, Excel isn’t working for you yet. You need to build a solid data cleaning architecture, that automates these manual steps.
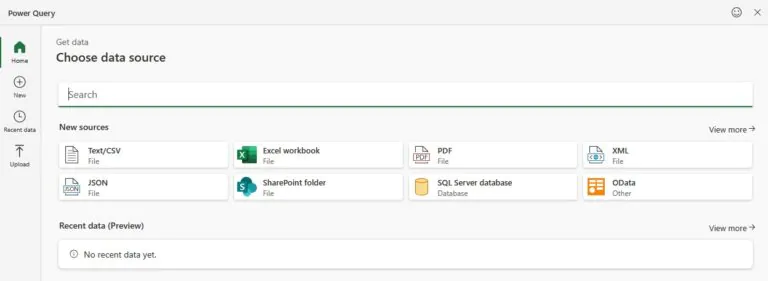
Using Power Query, you can import the data, clean it, build custom functions and then save all these steps to be repeated for next time.
2 – Formatting Instead Of Structuring
This one might surprise you!
Formatting is useful, and genuinely very important when it comes to presenting your data. Clear headings, readable layouts, and well-design reports absolutely matter.
However, I see a lot of people using formatting as a substitute for structure, and that’s a bad habit. Instead of fixing their spreadsheets and datasets, they focus on how it looks.
I see a lot of spreadsheets where:
- Categories are colour-coded instead of standardised
- Sections are separated with blank rows instead of using tables
- Headers are merged across columns instead of clearly defined
- Important values are being highlighted manually rather than calculated
Things look organised, but there isn’t any real structure or logic holding it together!
The main issue with this approach is scalability. When you get new data, you’re going to have to start all over again! All you’re doing is making your current spreadsheet look nice.
Colours are a classic example of this, people see spreadsheets analysing something like revenue, with red and green highlighting for low and high values. They like it, and they then go and manually highlight those entries in their own datasets.
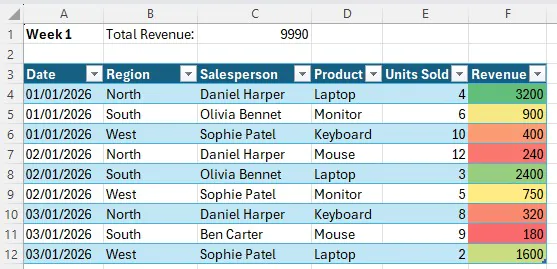
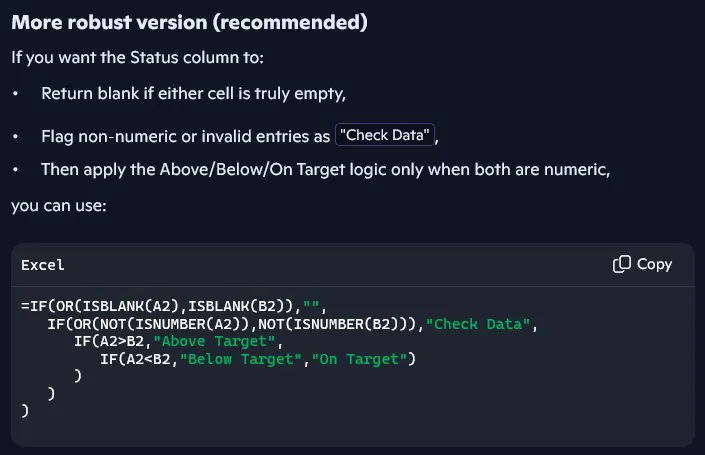
If you had your data in a table, and used conditional formatting on the revenue column, then you could set up your own custom rules for colouring based on values. Once your new data comes back in next week, your rules will still apply and do it for you!
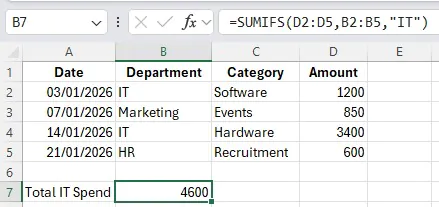
The key here is to not think about your formatting as a final step after using your spreadsheet, integrate it with the process. If you want to highlight key values, use conditional formatting, if you want people to look at a subset of your data (like just one Region) then don’t copy across your data! Build a reliable table from the get-go, and make sure the data is cleaned so that filter works at the end.
3 – Staying Comfortable In Excel
Another huge habit I see (and that I used to have!) is not learning new things.
Lots of us learned Excel 10+ years ago, and it had a very solid baseline of tools then!
You could cross-reference data with VLOOKUP, you could build PivotTables, and it even had conditional logic with things like the IF function. And just to be clear, none of these tools are “wrong”.
But, Microsoft has been adding functions features and tools for years, and they get more and more advanced! Excel has changed massively in the last few years, we have dynamic arrays, Power Query, regex support and incredible new functions. You might be looking at Power Query and thinking “that’s not new”, but trust me some people never learned to use it!
In much the same way, just because you know all these tools doesn’t mean you’re future-proof. Excel isn’t going anywhere, and there are going to be new things added every year that could completely revolutionise the way you work!
My advice here is to keep learning, it’s a great exercise for your mind and is going to make you a better Excel user. Keep an eye on Excel on the 365 Roadmap, read up on blog posts and just try things out!
4 – Trusting What Excel Gives You
Excel is a tool, and it only works with what you give it.
You write out your formula, Excel returns a number and boom – job’s done!
No sanity-checking.
No cross-checking.
No “does this actually look right?”
People do this all the time – especially if you’re working with a time pressure! Excel gives you the feeling of authority, because it’s a deterministic system. If you enter everything correctly, it’s always going to produce the right output. Make a mistake in your formula, and it will produce an error, so why doubt it?
Well, what if you didn’t input everything correctly?
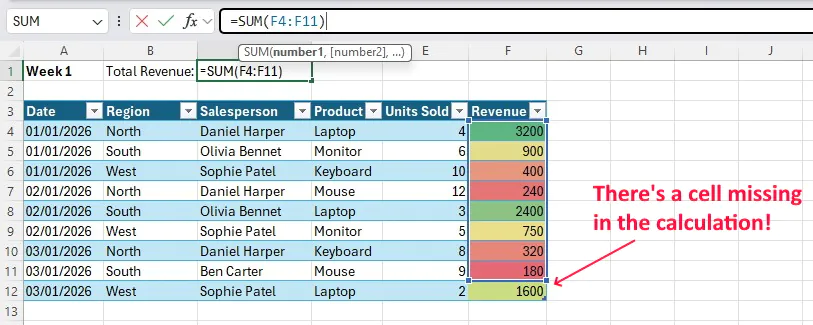
Maybe you missed a row, maybe your lookup is pointing at the wrong column, you might just have your data formatted incorrectly! No matter how rigid your process is, everyone makes mistakes. Sometimes despite all the time you put in, something isn’t quite right – and the fact that Excel still gives you an answer does not mean all is good.
Good Excel users develop a habit of sanity-checking outputs, even when they think everything was done correctly. They click into their functions to see what data it references, calculate things outside of Excel to make sure they can trust their logic, and they question things.
In the short term, it seems like a bothersome waste of time. Long term, it’s going to save you not just time, but also stress.
When your manager comes to you and asks: “are you sure this is right?” you don’t want your heart to drop, you want to have the confidence to say yes. Business decisions are made from data, there’s no room for error.
- Facebook: https://www.facebook.com/profile.php?id=100066814899655
- X (Twitter): https://twitter.com/AcuityTraining
- LinkedIn: https://www.linkedin.com/company/acuity-training/