
How Popular Is PowerPoint In 2024! New Statistics
Contents
- 1 The Key Facts
- 2 How Many Powerpoint Users Are There in the UK?
- 3 Powerpoint, Google Slides and Keynote in Search
- 4 Month to Month Search Trends
- 5 How Many of us Have Created Presentations?
- 6 Regional Variations
- 7 Demand For Powerpoint Training
- 8 Powerpoint User Base Size Globally
- 9 The Future Of Powerpoint?
We’ve probably all sat through a Powerpoint at some stage in our lives, whether at school, university, at work or when attending an event.
But how many users does Powerpoint have in 2023? And how does that compare with the usage of competitors like Apple’s Keynote, Google Slides and others.
We polled over 2,000 people in the UK, looked at Google search habits and crunched the numbers to find out. Here’s our 2023 Powerpoint Statistics round up.
We also offer comprehensive PowerPoint courses to keep you up to date with the most popular presentation tool of all time!
The Key Facts
If you’re just here for the quick numbers, that’s ok! Of all of our Powerpoint facts, figures and findings, we think these are the most important:
- More than 20.3 million people in the UK (over 16s) have used Powerpoint
- Over half (53%) of people in the UK have been required to create presentations either at work or in their personal lives
- This figure rises to a notable 83% amongst those aged 16 to 24 and 76% amongst those aged 25 to 34
- Powerpoint is the most popular platform for creating presentations, with over 20.3 million people aged 16 or over in the UK having used it at some point (37.15% of those over 16)
- Google Slides comes in second (13.28% have used it)
- Amongst those aged 16 to 24, 48.67% have used Powerpoint
- Amongst those aged 25 to 34, 46.97% have
How Many Powerpoint Users Are There in the UK?
Ok, so we’d hazard a guess you sat through someone else’s Powerpoint before. But have you made one of your own?
In March 2023, We polled 2,011 people in the UK to ask them:
- What, if anything, have you ever used in your personal or work life to create presentations?
- Powerpoint
- Google Slides
- Microsoft Sway
- Keynote
- Visme
- Other
- I have never created presentations
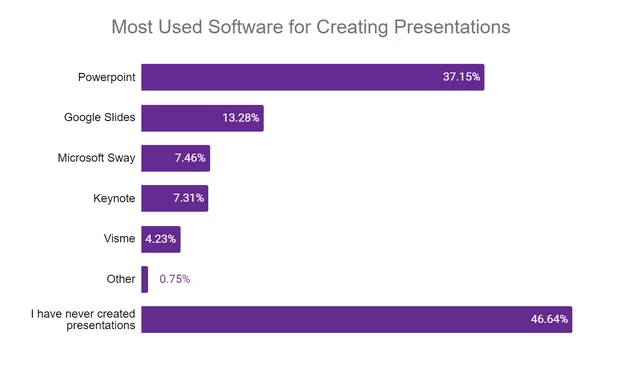
Here’s what they told us:
| What, if anything, have you ever used in your personal or work life to create presentations? | |
| Response | % who gave this response |
| Powerpoint | 37.15% |
| Google Slides | 13.28% |
| Microsoft Sway | 7.46% |
| Keynote | 7.31% |
| Visme | 4.23% |
| Other | 0.75% |
| I have never created presentations | 46.64% |
Based on these statistics, we can estimate the number of people aged 16 or over in the UK who’ve used these presentation software packages at some stage in their work or personal lives. We see that:
- 29,194,167 people have, at some stage, created a presentation
- Over 20.3 million have used Powerpoint
- Over 7.2 million have used Google Slides
- Over 4 million have used Microsoft Sway
- Over 4 million have used Apple Keynote
However, what was incredibly clear to see is that the presentation software packages people have used varies quite considerably from age group to age group.
If we look at the above data again but segmenting this by age, we see:
| What, if anything, have you ever used in your personal or work life to create presentations? | |||||
| Response | 16 to 24 | 25 to 34 | 35 to 44 | 45 to 54 | 55+ |
| Powerpoint | 48.67% | 46.97% | 42.22% | 33.24% | 28.55% |
| Google Slides | 26.62% | 23.64% | 18.10% | 10.79% | 3.29% |
| Microsoft Sway | 14.83% | 12.73% | 14.60% | 4.96% | 0.79% |
| Keynote | 14.45% | 17.88% | 8.57% | 4.66% | 0.92% |
| Visme | 10.27% | 10.00% | 4.44% | 2.62% | 0.26% |
| Other | 0.76% | 0.30% | 0.32% | 0.87% | 1.05% |
| I have never created presentations | 16.73% | 23.64% | 37.78% | 54.23% | 67.24% |
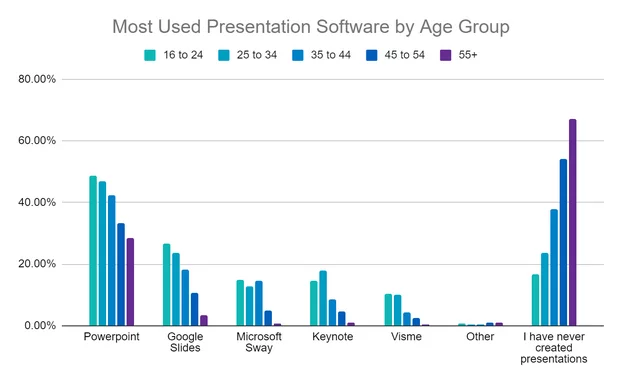
- Amongst all age groups, Powerpoint is (by far) the most commonly used presentation creation software
- The almost half of 16 to 24 year olds who have used Powerpoint represents around 3.4 million of them
- Of those aged over 55, around a third have created presentations. Almost all of those have done so with Powerpoint and there’s very little usage of other software packages amongst this age group
- Apple’s Keynote offering is neck and neck across all most groups with Microsoft Sway (coming in 4th on average though), but amongst the 25 to 34s, it’s the third most popular presentation creation software package, with 17.8% of those in this age group having used it
- Across all age groups though, it’s clear that Powerpoint is considerably more commonly used for creating presentations
At Acuity Training, we run top-rated presentation skills courses to help people get the most out of their presentations, in and out of PowerPoint!
Powerpoint, Google Slides and Keynote in Search
One way to get into the psyche of anyone is to take a look at their Google Search History. And though we can’t imagine many would want us perusing their web history, we are able to get a bit of insight here using data from Google (via kwfinder.com) about the average number of searches for various keywords relating to presentation creation software over time.
We looked at how many people globally have been searching for Powerpoint, Google Slides and Keynote over time and here’s what we found.
| Year | Google Searches Globally for “Powerpoint” | Google Searches Globally for “Google Slides” | Google Searches Globally for “Keynote” |
| 2016 | 27,690,000 | 25,300,000 | 2,209,000 |
| 2017 | 30,800,000 | 44,560,000 | 2,140,000 |
| 2018 | 31,690,000 | 57,600,000 | 2,245,000 |
| 2019 | 24,840,000 | 64,630,000 | 2,134,000 |
| 2020 | 32,410,000 | 64,370,000 | 2,322,000 |
| 2021 | 42,180,000 | 65,110,000 | 2,283,000 |
| 2022 | 40,830,000 | 62,840,000 | 2,115,000 |
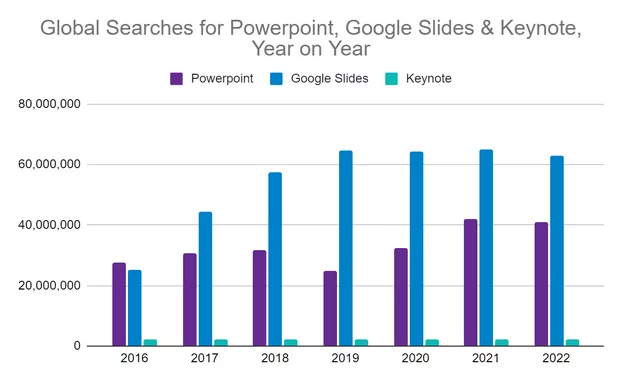
Figure calculated by pulling search estimates for each month of each year and totalling them for the annual figure.
It’s worth noting that, of course, people looking for “keynote,” with this also being a word used in common language, might not be specifically looking for the presentation software.
We found that, despite a significantly higher proportion of people in the UK having used Powerpoint, more people by some way now search for Google Slides.
A likely reason for that is the fact that Google Slides is accessed through a browser, so its users are much likelier to head to search to get to it than Powerpoint users (who would simply open that app on their device).
Month to Month Search Trends
Do searches for Powerpoint and Google Slides have seasonal trends?
In short, yes.

For both “Powerpoint” and Google Slides” the month with the fewest searches in recent years has consistently been July.
If we’re to make assumptions or suggestions about the possible reasons for this, summer holiday season is a likely one. We can fairly assume that presentation creation is something people are likelier to do as part of their work rather than a personal thing. And if we’re in the middle of summer holiday season, then less work is being done.
How Many of us Have Created Presentations?
29,194,167 of the UK’s population aged 16 and over has, at some stage, created a presentation.
Although we set out with our survey to find out which presentation software packages people are using, we also uncovered numbers surrounding the prominence of presentation creation as something we’re doing at work or in our personal lives.
We found that more than half of us have, at some stage, created a presentation. But the variation in this both in terms of age and in terms of region is quite notable.
Let’s take a look at the statistics.
| Age Group | Percentage of People Who’ve Created a Presentation Before | Number of people this equates to |
| 16 – 24 | 83.27 | 5,881,748 |
| 25 – 34 | 76.36 | 6,889,476 |
| 35 – 44 | 62.22 | 5,415,525 |
| 45 – 54 | 45.77 | 4,052,957 |
| 55+ | 32.76 | 6,901,547 |
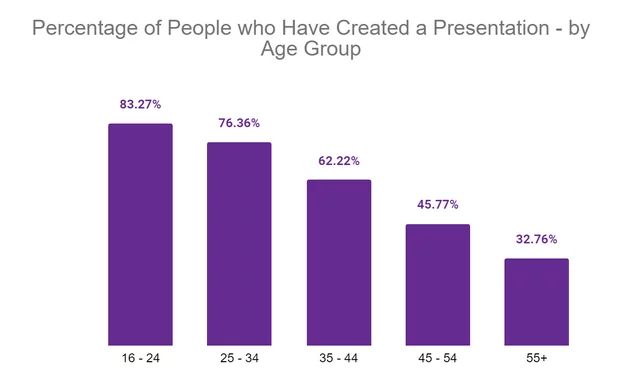
As an absolute rule according to our statistics, the younger you are the likelier you are to have created a presentation. The overwhelming majority of those aged 16 to 24 have and over three quarters of those aged 25 to 34 have.
But by the time we reach the 45 to 54s, the figure drops to below half and in our oldest age group, less than a third have done so.
Regional Variations
Another thing that influences how likely someone is to have created a presentation before is where they live.
Here’s what we found.
| UK Region | Percentage of People Who’ve Created a Presentation Before |
| East of England | 49.2 |
| Greater London | 75.38 |
| East Midlands | 56.08 |
| West Midlands | 50.57 |
| North East | 48.15 |
| North West | 52.27 |
| Northern Ireland | 56.14 |
| Scotland | 47.93 |
| South East | 47.46 |
| South West | 46.20 |
| Wales | 44.33 |
| Yorkshire and the Humber | 54.55 |
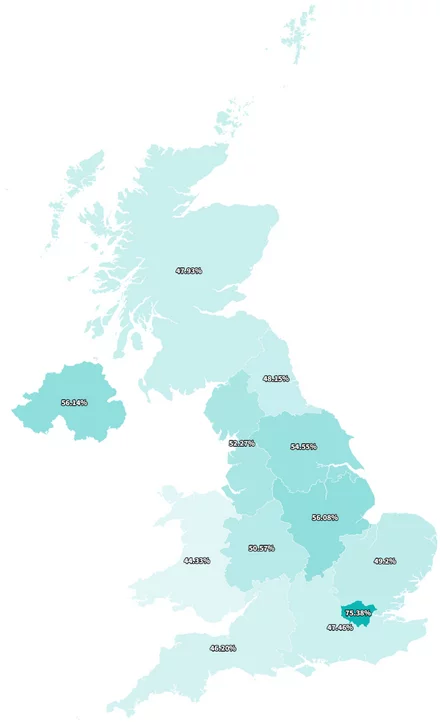
It will probably come as little surprise to find that those in Greater London are the likeliest to have created presentations before – over three quarters have done so.
London is considerably ahead in terms of these numbers two. The region in which the second highest proportion of its residents have created presentations is Northern Ireland, where 56.15% have done so, closely followed by the East Midlands (56.08%).
Wales is where the lowest proportion of people have created a presentation (44.33%).
Demand For Powerpoint Training
With so many of us having created presentations, it will come as little surprise that Powerpoint training courses are in demand. We see this in our own data, but we also took a look at Google Search Data in the UK for:
- Powerpoint course
- Powerpoint training
We found the following, going back to 2018:
| Month | UK Searches for “Powerpoint Training” | UK Searches for “Powerpoint Course” |
| Jan-18 | 260 | 260 |
| Feb-18 | 170 | 210 |
| Mar-18 | 260 | 260 |
| Apr-18 | 260 | 170 |
| May-18 | 210 | 210 |
| Jun-18 | 210 | 170 |
| Jul-18 | 210 | 210 |
| Aug-18 | 210 | 320 |
| Sep-18 | 170 | 320 |
| Oct-18 | 260 | 210 |
| Nov-18 | 210 | 170 |
| Dec-18 | 170 | 170 |
| Jan-19 | 260 | 260 |
| Feb-19 | 320 | 320 |
| Mar-19 | 320 | 260 |
| Apr-19 | 320 | 260 |
| May-19 | 320 | 210 |
| Jun-19 | 320 | 260 |
| Jul-19 | 320 | 260 |
| Aug-19 | 320 | 210 |
| Sep-19 | 320 | 260 |
| Oct-19 | 320 | 260 |
| Nov-19 | 320 | 260 |
| Dec-19 | 260 | 260 |
| Jan-20 | 480 | 590 |
| Feb-20 | 390 | 480 |
| Mar-20 | 320 | 390 |
| Apr-20 | 390 | 320 |
| May-20 | 720 | 260 |
| Jun-20 | 590 | 260 |
| Jul-20 | 390 | 260 |
| Aug-20 | 260 | 210 |
| Sep-20 | 320 | 210 |
| Oct-20 | 320 | 260 |
| Nov-20 | 320 | 260 |
| Dec-20 | 210 | 210 |
| Jan-21 | 390 | 320 |
| Feb-21 | 480 | 480 |
| Mar-21 | 390 | 260 |
| Apr-21 | 260 | 210 |
| May-21 | 260 | 210 |
| Jun-21 | 260 | 210 |
| Jul-21 | 260 | 210 |
| Aug-21 | 210 | 210 |
| Sep-21 | 260 | 260 |
| Oct-21 | 320 | 260 |
| Nov-21 | 260 | 260 |
| Dec-21 | 210 | 210 |
| Jan-22 | 260 | 260 |
| Feb-22 | 320 | 260 |
| Mar-22 | 260 | 210 |
| Apr-22 | 260 | 210 |
| May-22 | 260 | 210 |
| Jun-22 | 260 | 210 |
| Jul-22 | 210 | 210 |
| Aug-22 | 210 | 210 |
| Sep-22 | 260 | 210 |
| Oct-22 | 260 | 210 |
| Nov-22 | 260 | 260 |
| Dec-22 | 210 | 210 |
| Jan-23 | 320 | 320 |
| Feb-23 | 320 | 260 |
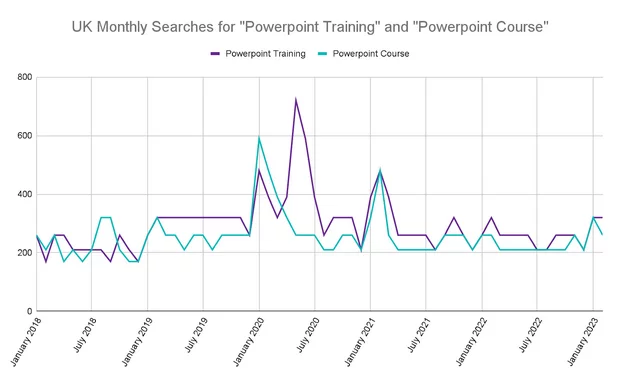
We saw a surge in demand over some Covid months during the lockdowns in the UK, with people potentially using their extra time at home to upskill.
Powerpoint User Base Size Globally
So we know how many people in the UK have at some point used Powerpoint. But how many paying users does it have globally?
Well, getting an accurate number isn’t as simple as we’d like. Microsoft doesn’t release data pertaining specifically to Powerpoint, as this package is sold as part of its wider Microsoft Office offering.
What we do know from its latest figures release is that:
- There are 59.7 million Microsoft Office consumer edition subscribers (who have access to Powerpoint as part of a subscription)
- In addition to this, there are commercial subscriptions but no specific subscriber number was provided
The Future Of Powerpoint?
Without doubt, Microsoft’s flagship presentation creation offering has tough competition with the likes of Google Slides. But it remains the most commonly used package for presentation creation and doesn’t look to be going anywhere anytime soon.
Methodology and Caveats
Let us explain a little about how we compiled our Powerpoint statistics.
Our survey was conducted on our behalf by Censuswide, an accredited market research company in the UK that employs professionals who adopt the ESOMAR standards. Some things it’s important to know about our survey and how we used the data:
-
- Our sample was 2,011 people in the UK aged 16 and over
- They were posed the question over a 3 day period in early March 2023
- To calculate how many people have ever created presentations, we subtracted the proportion that said they had never done so from 100
- The sample was demographically representative – which is really important when it comes how we used population data
When we’ve talked about how many millions of people have used Powerpoint, we’ve done so by extrapolating based on UK Government mid 2021 population estimates, which estimate the UK population aged 16 and over as 54,711,707.
Breakdowns by age are as follows:
-
- 16 to 24: 7,063,466
- 25 to 34: 9,022,362
- 35 to 44: 8,703,834
- 45 to 54: 8,855,051
- 55+: 21,066,994
Using this data and bearing in mind that our survey panel was demographically representative, we were able to calculate how many people any given percentage would equate to. So, for example, if we know that 37.15% of all people in the UK aged 16 and over have used Powerpoint and we know that there are 54,711,707 people aged 16 and over in the UK, we can calculate 37.15% of that figure as 20,325,399.
When it comes to our Google Search estimates, we used a tool called kwfinder.com, which is a tool that pulls in data from Google Ads to estimate the number of searches for a given keyword, in a given location over a given timeframe.
These figures are an estimate.
If you have any further questions about our research or would like to see a copy of the raw data, please contact max@acuitytraining.co.uk !
For more on PowerPoint check out our guide to outline view here!

- Facebook: https://www.facebook.com/profile.php?id=100066814899655
- X (Twitter): https://twitter.com/AcuityTraining
- LinkedIn: https://www.linkedin.com/company/acuity-training/